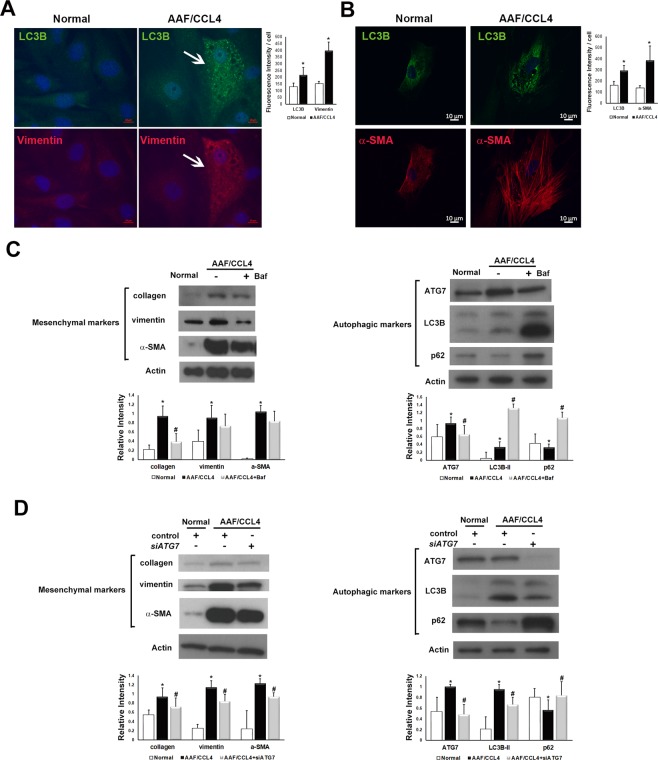
Figure 5.
Effect of autophagy on the mesenchymal phenotype of ductular cells from AAF/CCL4 livers. (A,B) Immunofluorescence images of isolated ductular cells demonstrating LC3B was associated with the mesenchymal markers vimentin (A) and α-SMA (B). (Right) Quantification of images was performed using Zen-Pro software (Zeiss) and normalized to the number of nuclei. (C) Ductular cells were cultured for 3 days and then treated with or without bafilomycin A1 (Baf, 100 nM) for another 24 hours. Representative Western blot analysis confirmed the increased expression of mesenchymal markers in AAF/CCL4 cells compared to normal cells. Treatment of AAF/CCL4 cells with Baf suppressed the expression of mesenchymal markers. Full-length blots are presented in Supplementary Fig. S7. Quantitative analysis of mesenchymal markers (left panel), and autophagic markers (right panel) was shown below. (D) Inhibition of autophagy by ATG7 small interfering RNA (siATG7) reduced the protein levels of mesenchymal markers. Full-length blots are presented in Supplementary Fig. S8. Quantitative analysis of mesenchymal markers (left panel), and autophagic markers (right panel) was shown below. Statistical analysis was analyzed by Student’s unpaired t-test. *P < 0.05 compared with normal group; s#P < 0.05 compared with AAF/CCL4 groups.

