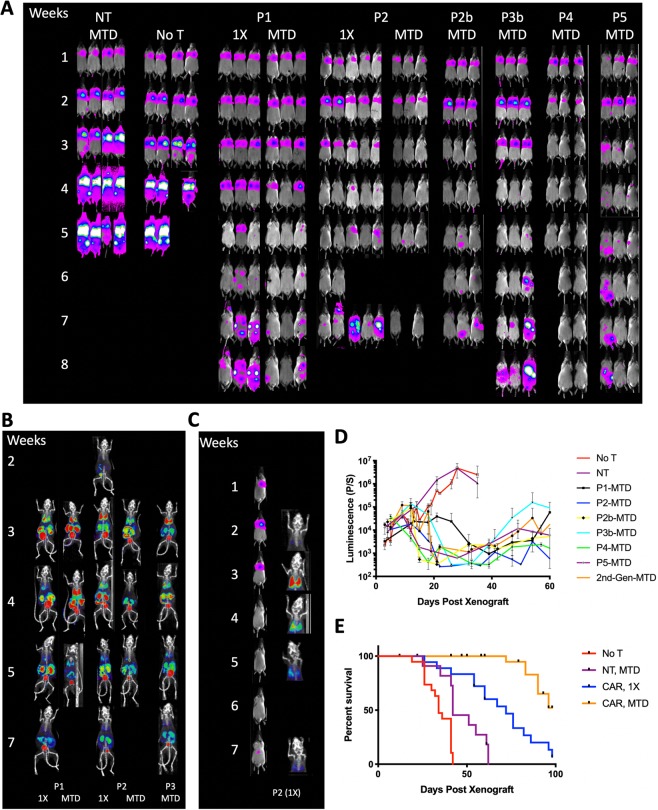
Figure 3.
Assessment of in vivo activity of AIC100 by tumor elimination, T cell imaging, and survival. (A) A weekly measurement of whole body luminescence to detect tumor growth or killing by AIC100. Luminescence intensity is pseudocolored in the range of 103–105 photons/sec/mm2. Time elapsed after tumor xenograft is shown in weeks. (B) PET/CT imaging by 18F-NOTAOCT to image CAR T cell distribution. Images are maximum intensity projections of the entire mouse body (~20-mm-thick plane). PET intensity is pseudocolored in the range of 1–10% injection dose/cm3. (C) Longitudinal imaging of tumor and AIC100 distribution dynamics, illustrating the occurrence of T cell peak (week 3) post tumor peak (week 2), followed by contraction of T cells. (D) Tumor burden in lungs was estimated by the level of luminescence. Mice were treated with AIC100 (P1 to P5 batches used at 1X or MTD), no T cells (No T), non-transduced T cells at MTD (NT), or F292A CAR 2nd generation (41BB-CD3ζ) at MTD. (E) Survival curves of 8505C xenografted mice comparing no treatment (n = 19), treatment with NT T cells (n = 11), and treatment with 1X (n = 19) and MTD (n = 27) CAR T cells until 100 days post xenograft.

