Figure 6.
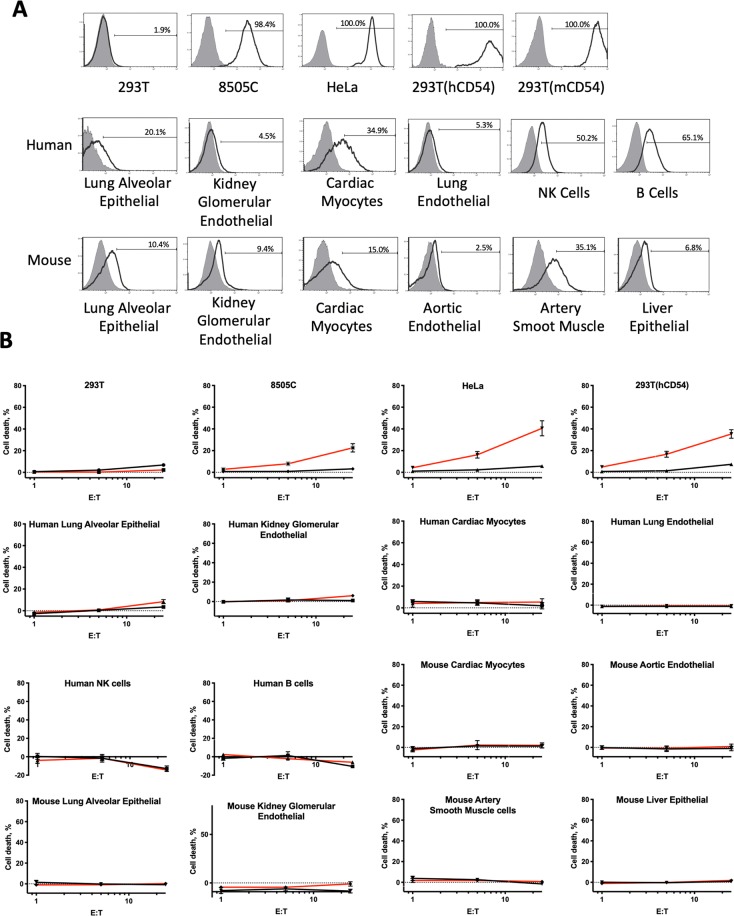
ICAM-1 expression and toxicity of AIC100 against primary cells of human and mouse tissues. (A) Primary human and mouse cells were tested for ICAM-1 expression by flow cytometry. Filled and open histograms correspond to unlabeled and anti-ICAM-1 antibody stained cells, respectively. Percent ICAM-1 positive is shown. (B) Target cells were incubated with T cells (red and black lines are of AIC100 and non-transduced T cells, respectively) for 4–5 h at 37 °C at the ratios of 25:1, 5:1, and 1:1. Cell death was calculated as %(treated − spontaneous)/(maximum − spontaneous), where treated, spontaneous, and maximum refer to the release of 51Cr from target cells with incubation with T cells, without T cells, and after lysis, respectively. Data are shown as mean ± sem.

