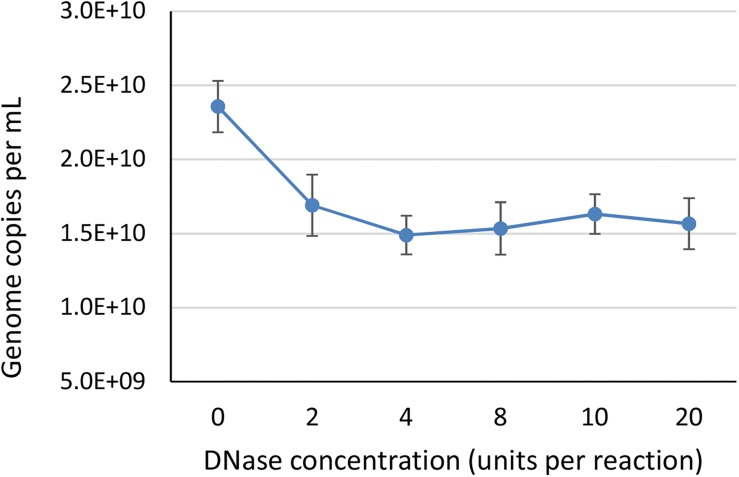
FIGURE 2.
The effect of different DNase concentrations in units per 200 μL reaction, on the determined vector genome titer using ddPCR. Each DNase concentration was tested in two independent replicates, with two dilutions each in two technical replicates, resulting in total eight data points per DNase concentration. Error bars represent ±1 SD.

