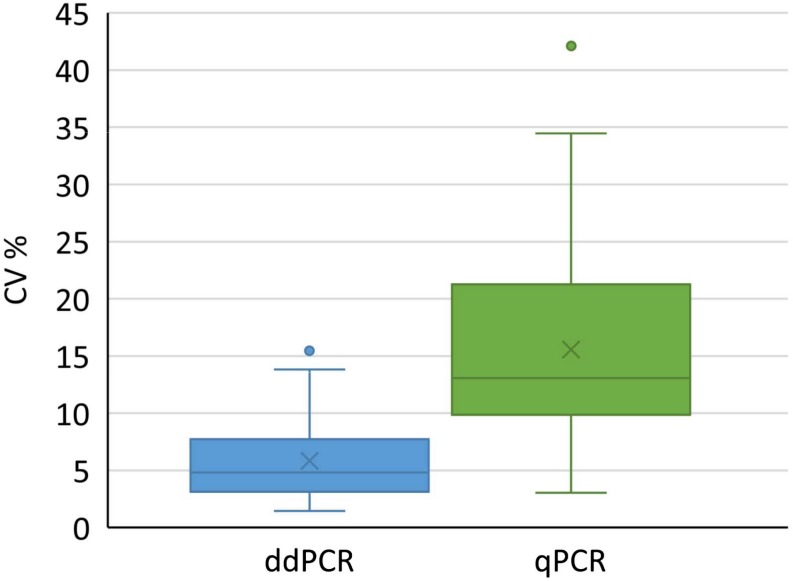
FIGURE 5.
Distribution of coefficients of variation for results obtained with ddPCR and qPCR by testing 73 and 62 samples, respectively. Boxes represent the values between Q1 and Q3, whereas whiskers represent 1.5 interquartile range, horizontal lines represent medians, crosses represent average values. Individual points outside whiskers represent outliers. The CV% for each sample was calculated from at least six replicates. Results of both groups were significantly different (t-test, p < 0.001).

