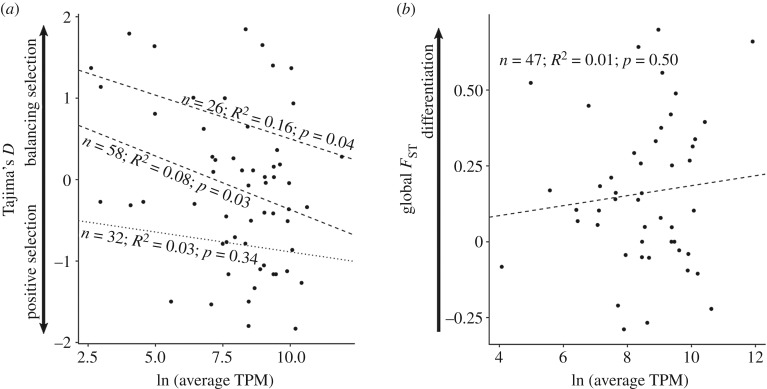
Figure 3.
Relationship of (a) Tajima's D and (b) Weir and Cockerham's FST with the average toxin expression calculated by log-transformed transcripts per million (TPM) in [28]. Tajima's D was analysed in three ways: we analysed all toxins together (middle line), and then separately analysed values greater than (upper line) and less than (lower line) zero. Tajima's D shows a significant correlation when considering all toxins or toxins found to have a positive Tajima's D value.

