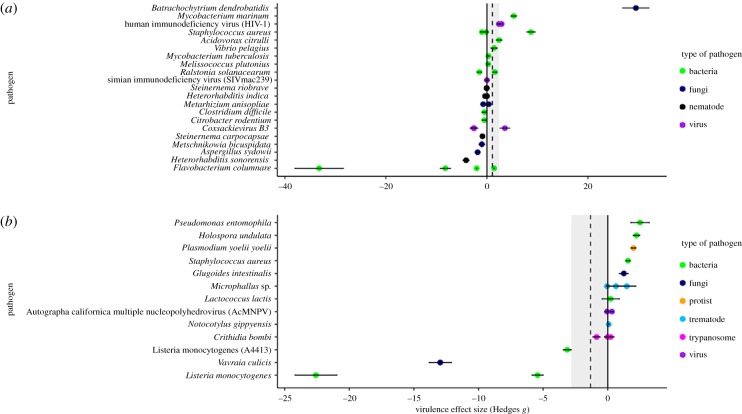
Figure 2.
Forest plots of nutrient quality (a) and quantity (b) and their effects on virulence effect size (Hedges's g ± 1 s.e.) for each pathogen species. Dotted line shows the overall effect size with the grey area demarcating the margin of error. Values of Hedges's g equal to zero represent no difference in pathogen virulence between treatments. Positive Hedges's g values represent cases where the pathogen virulence is greater in the higher nutrition treatment group than the lower nutrition group. Negative Hedges's g values represent cases where the pathogen virulence is greater in the lower nutrition treatment group than the higher nutrition group. (Online version in colour.)

