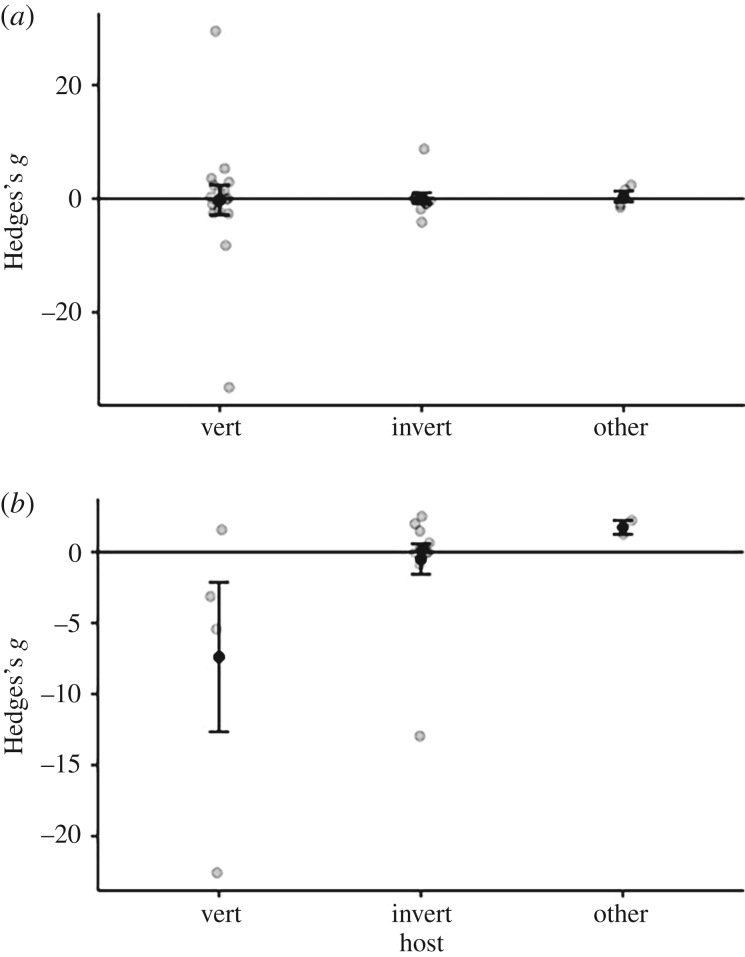
Figure 4.
Virulence effect size (Hedges's g) for vertebrate and invertebrate hosts as well as ‘other’ hosts (including plants, zooplankton and ciliates) for treatments manipulating nutrient quality (a) and quantity (b). Black points represent mean values ± 1 s.e. The raw data are displayed as jittered points.

