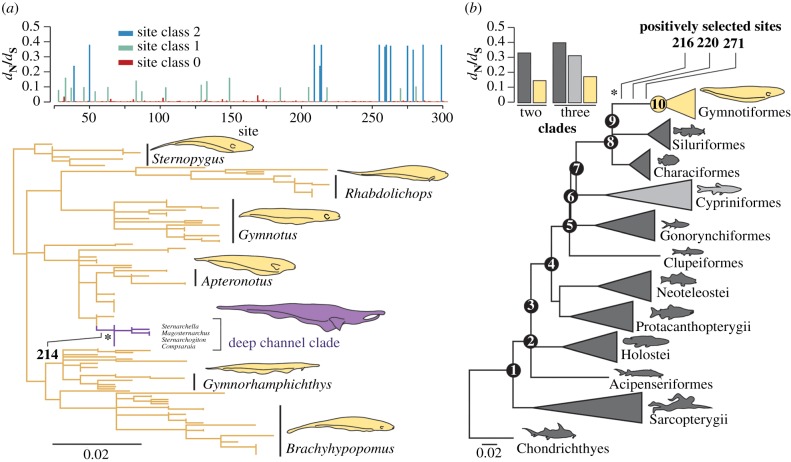
Figure 1.
Patterns of molecular evolution in gymnotiform rhodopsin compared across sites and with other vertebrate lineages. (a) Mean dN/dS estimates for each site in our gymnotiform rhodopsin dataset estimated using the random-sites model M3 in PAML and a maximum-likelihood gymnotiform rhodopsin gene tree (more detailed trees in electronic supplementary material, figures S2 and S3). Clade of deep-channel specialists shown in purple. (b) dN/dS estimates for sites in the divergent site class of clade model D using different partitioning schemes (coloured to match the vertebrate species tree). All branch lengths represent the number of amino acid substitutions per site and positively selected sites identified on branches under positive selection (asterisks) are labelled. (Online version in colour.)

