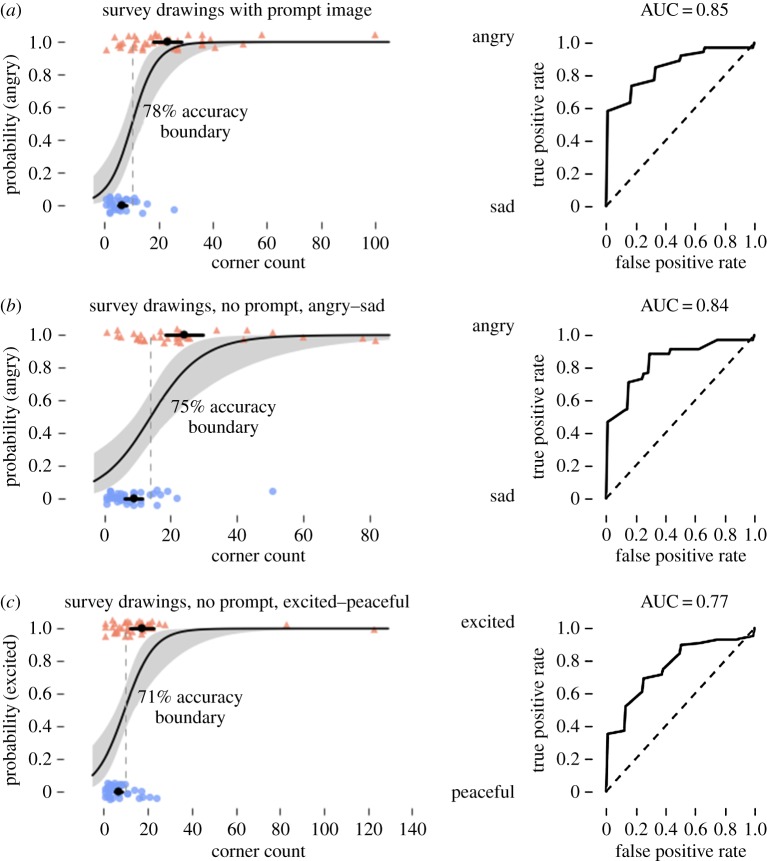
Figure 6.
Bayesian logistic regression classification of angry, sad, excited and peaceful drawings from our survey participants. For all logistic regression plots, black dots and bars show means and 95% CIs of the mean, and the dotted line shows the 50% probability boundary. (a) Participants were shown a prompt image and asked to draw a shape conveying the opposite arousal negative emotion. (b,c) Participants were shown no prompt image and asked to draw a shape that was angry, sad, excited or peaceful.

