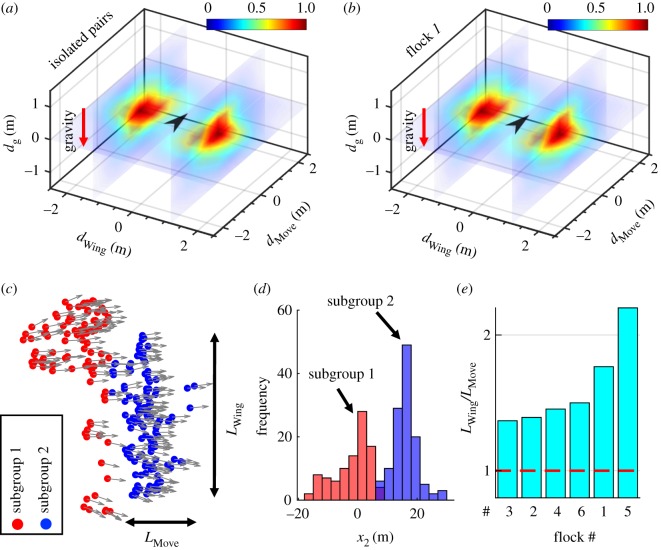
Figure 6.
(a,b) Probability density distributions of the location of the first nearest neighbour bird (a) in isolated pairs and (b) in a large flock (flock 1). The focal bird is located at the origin. dg is the distance in the gravity direction. (c) Distribution of bird locations (dots) projected on the horizontal plane for flock 1, showing two subgroups separated along the flight direction. The vectors are the movement directions of individual birds. (d) Corresponding histogram of bird positions along the flight direction (x2). Data for flocks 2–6 can be found in electronic supplementary material, figures S4 and S5. (e) Ratio of the subgroup size in the wing direction (LWing) to the subgroup size in the movement direction (LMove). (Online version in colour.)

