Figure 5.
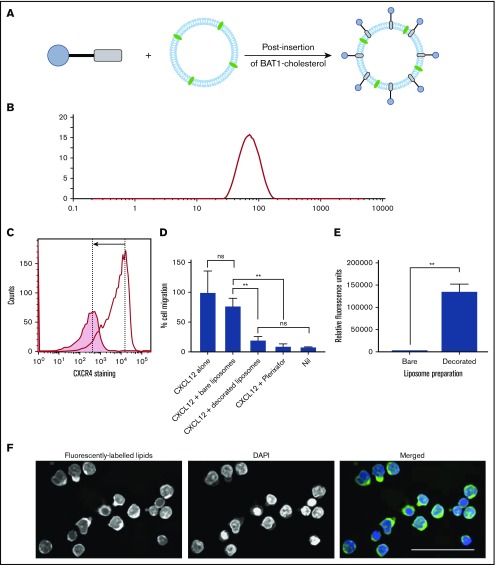
BAT1-cholesterol can be used to decorate fluorescently labeled liposomes, resulting in significantly higher uptake into cells. (A) Illustration of the prepared liposomes, indicating BAT1-cholesterol decoration of the fluorescently labeled liposomal membrane using the postinsertion method. (B) Liposome sizes were assessed using DLS. A representative line graph from the analysis is shown: intensity is related to particle size using the Mie scattering function. (C) CXCR4 antibody staining was used to assess the specificity of liposome binding. Cells were stained with phycoerythrin-CXCR4 antibodies following incubation with bare liposomes (black line) or BAT1-decorated liposomes (filled graph). In the presence of bare liposomes, ∼94% of the live cells are stained to a high level. In the presence of BAT1-labeled liposomes, ∼37% of cells are stained, and the median fluorescence is significantly lower. Cell staining reduction is indicated by the arrow. (D) Cell migration in response to CXCL12 was measured using a filter migration assay. Data shown are from 1 representative case. Experiments were performed in triplicate, means were taken across the triplicates, and errors were calculated as the standard deviation of the mean. BAT1-decorated liposomes inhibit migration along a CXCL12 gradient: no significant difference in migration inhibition is observed between BAT1-decorated liposomes and 20 μM plerixafor or the negative control. Further, no significant difference in migration was observed between cells incubated with bare liposomes and the positive control. **P < .01, 1-way analysis of variance with the Holm-Sidak multiple-comparisons test. (E) Flow cytometry was used to quantify levels of liposomal attachment and uptake. At only 30 µM liposomes, the cells incubated with decorated liposomes presented significantly higher levels of fluorescence (**P < .01, Student t test). (F) Laser deconvolution microscopy was used to show in which region of the cell the liposomes are located after a 3-hour incubation. Liposomes fluoresce in green, whereas nuclei are labeled with DAPI (blue). Images were prepared by building a z-projection (median intensity) from the image stack comprising the central region of the cell. The liposomes are observed throughout the cytoplasm. Scale bar, 50 µm.

