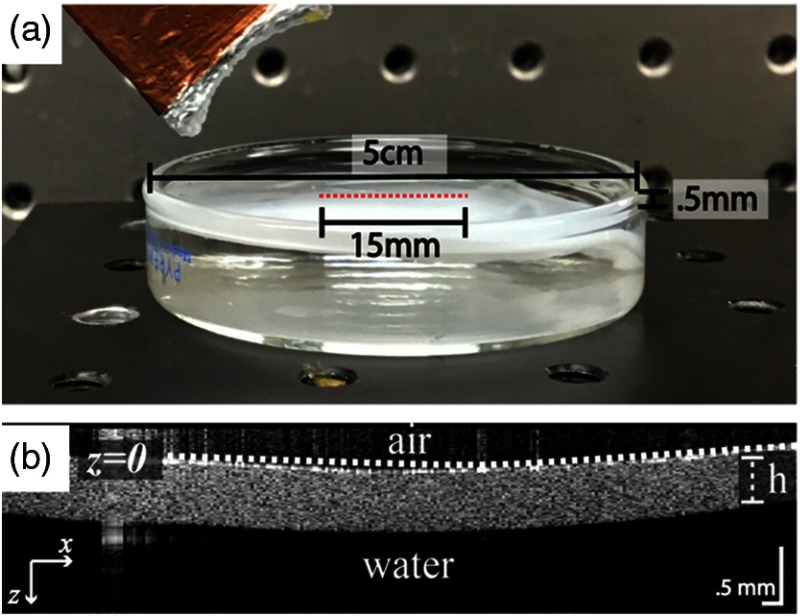
Fig. 2.
(a) Experimental setup showing a 0.5-mm-thick PVA phantom suspended on water boundary. An air-coupled transducer can be seen in the upper left. A red dotted line denotes an OCT B-scan line. (b) OCT structural image of thin-plate phantom. Note: uneven aspect ratio displayed to highlight phantom structure.

