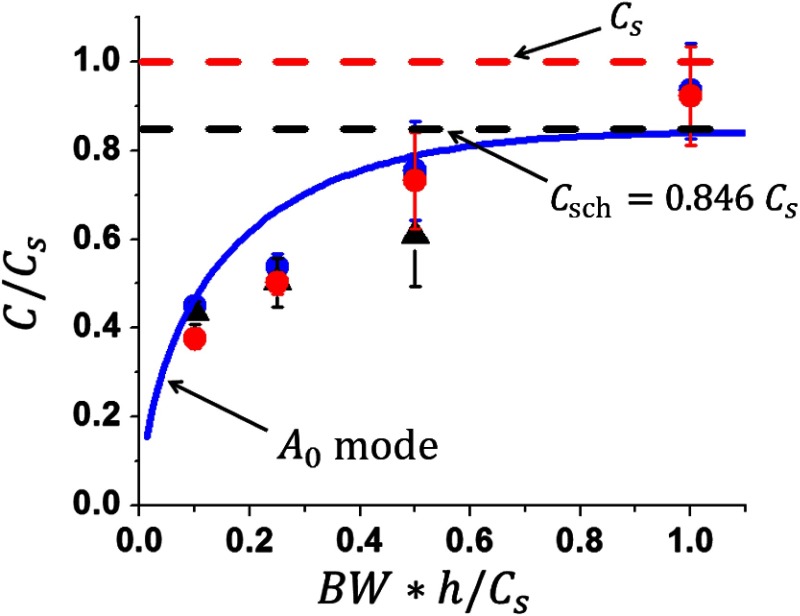
Fig. 7.
Mean value of group velocity as a function of signal bandwidth. Blue (obtained for a 1-mm thick medium) and red (obtained for a 0.5-mm thick medium) circular dots correspond to averaging over numerically simulated 2-D group velocity distributions [(c) in Fig. 3 and (c) in Figs. 4–6, respectively]. Black triangles correspond to averaging over experimentally obtained distributions [(f) in Figs. 4–6] for a 0.5-mm thick PVA sample. Solid blue line presents the dispersion curve for a guided mode of the lowest order (same as in Figs. 4–6). Dashed black line corresponds to the Scholte wave velocity asymptote for this mode (derived from Ref. 5 for an air/tissue/water system). Dashed red line corresponds to the true shear wave velocity. Error bars show variance of group velocity estimates in the plane.

