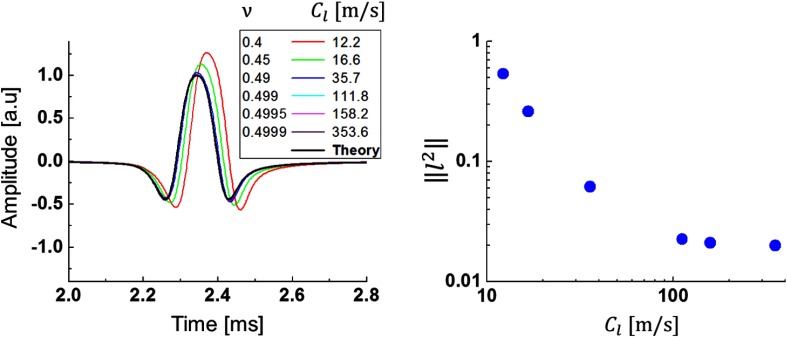
Fig. 9.
(a) Temporal profiles of Rayleigh wave signals at different Poisson’s ratios (corresponding to different values of longitudinal wave speed ) and (b) convergence curve for the norm of vibration speed as a function of longitudinal wave speed . Signal excitation parameters were and [see Eqs. (3)–(5)].

