
Figure 18.
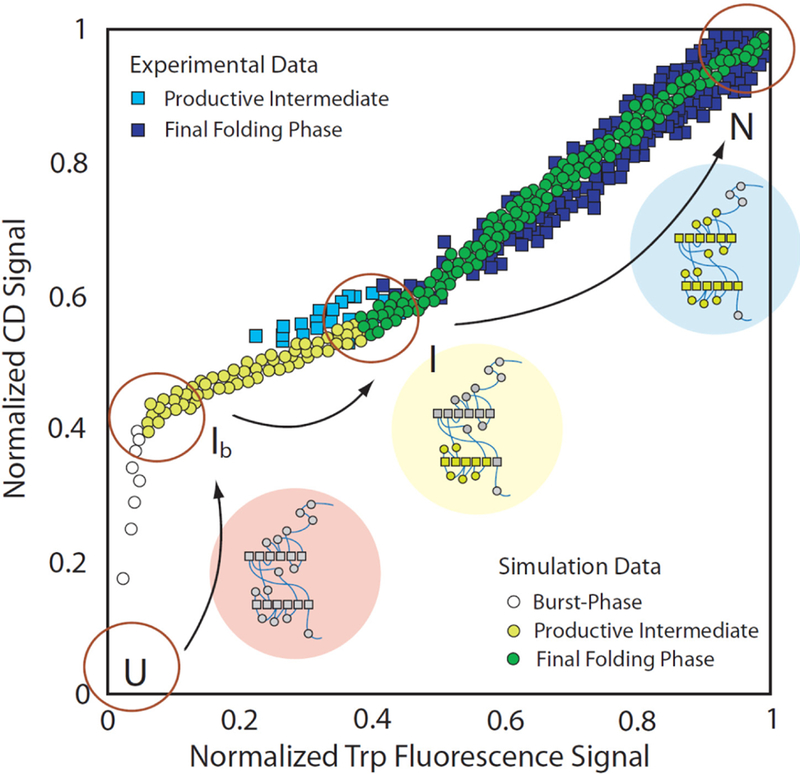
Comparing theoretical prediction to experimental data for LacI folding. Normalized CD signals are plotted as a function of fluorescence signals and color coded by phase (squares = experimental; circles = theoretical).
Official websites use .gov
A
.gov website belongs to an official
government organization in the United States.
Secure .gov websites use HTTPS
A lock (
) or https:// means you've safely
connected to the .gov website. Share sensitive
information only on official, secure websites.
Comparing theoretical prediction to experimental data for LacI folding. Normalized CD signals are plotted as a function of fluorescence signals and color coded by phase (squares = experimental; circles = theoretical).