Figure 2.
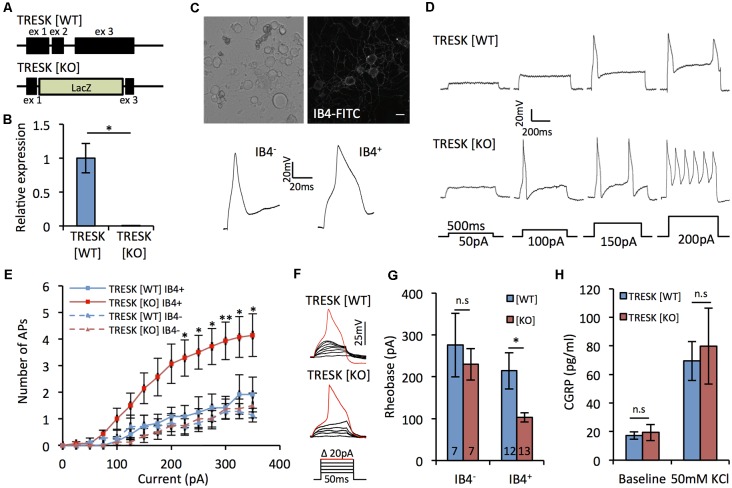
TRESK selectively modulates non-peptidergic C-fiber excitability. (A) Targeted ablation of KCNK18 gene. Allele describes neomycin/lacZ cassette, which replaces 3′ of exon 1, all of exon 2 and 5′ exon 3. (B) Real time PCR (RT-PCR) for TRESK expression in dorsal root ganglion (DRG) mRNA. Data derived from n = 3 animals. *p < 0.05, student’s unpaired t-test. (C) Neurons dissociated 24–48 h previously from TRESK [WT] and TRESK [KO] TG were used for patch clamp recordings. Example image of neurons live stained for IB4-FITC binding and typical action potential waveforms generated from IB4+ and IB4− neurons. Note the prolonged duration of the action potential of IB4+ neurons. (D) Example evoked firing profiles of IB4+ TG neurons of both genotypes in response to prolonged (500 ms) depolarizing steps. (E) Quantification of TG neuron firing in response to prolonged (500 ms) suprathreshold current stimulation. **p < 0.01, *p < 0.05, RM two-way analysis of variance (ANOVA) with Sidak multiple testing comparing TRESK [KO] IB4+ and TRESK [WT] IB4+ groups. Data represents mean ± SEM from 12 (TRESK [WT] IB4+), 7 (TRESK [WT] IB4−), 13 (TRESK [KO] IB4+) and 7 (TRESK [KO] IB4−) neurons. Recordings were pooled from TG obtained from two mice (per genotype) cultured independently on two separate days. (F) Example evoked firing profiles of IB4+ TG neurons of both genotypes in response to short (50 ms) depolarizing steps. (G) Rheobase of TG neurons, defined as the minimum current of 50 ms duration required to generate an action potential. *p < 0.05, Kruskal-Wallis followed by Dunn’s multiple comparisons test. Same sample sizes as (E), (H) CGRP released into culture media at baseline and during activation with 50 mM KCl containing media. Data derived from n = 3 animals, each with technical triplicates. n.s, p > 0.05. One-way ANOVA comparing genotypes for each condition.

