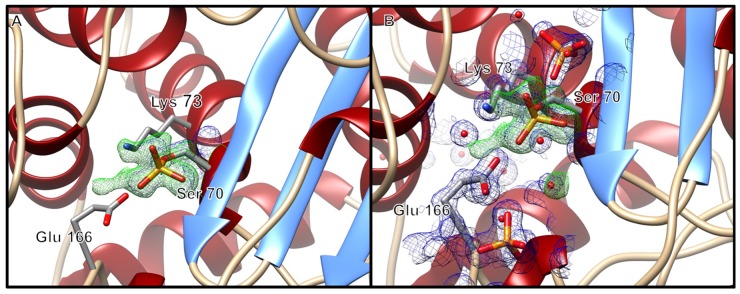
Figure 3.
(A) Ribbon diagram of the phosphoserine BlaC structure, zoomed in to display electron density about the nucleophilic Ser-70. (B) Ribbon diagram of the phosphoserine BlaC structure, with additional phosphate molecules and water molecules with electron density about the active site. The ribbon diagrams have electron density displayed within 3 Å of Ser-70, phosphate molecules and water molecules as a blue mesh at a 1.5 σ contour level for the 2mFo-DFc maps, and the mFo-DFc maps contoured at ±3 σ (green mesh/red mesh). The displayed mFo-Fc map was generated prior to modeling the phosphorylated Ser-70. The figure was generated with UCSF Chimera v1.12.

