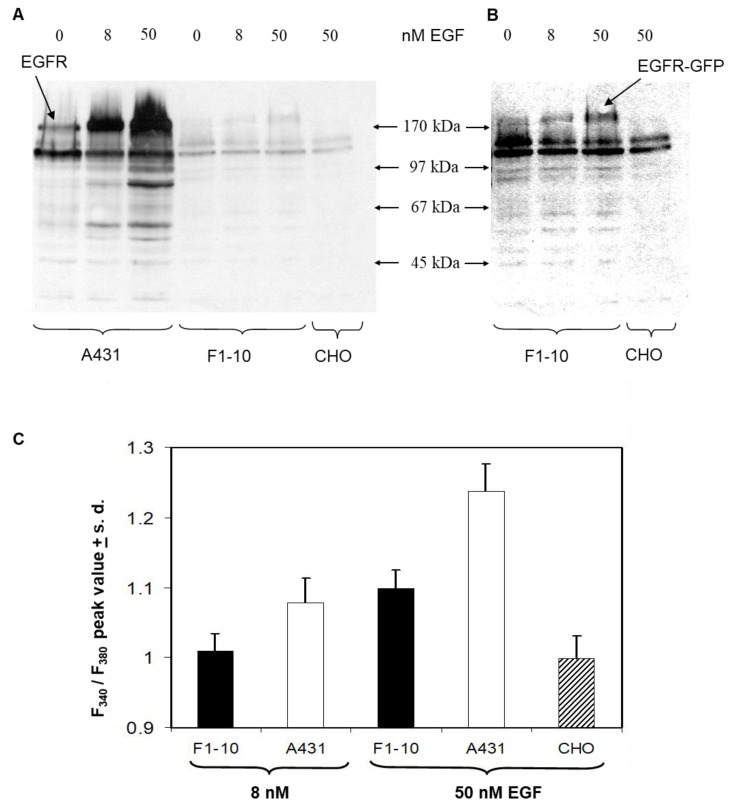
Figure 5.
Signaling competence of EGFR–eGFP. (A,B) Western-blot of EGFR in A431, F1-10 and CHO cells treated with different concentrations of EGF. Panel (B) is a contrast enhanced version of the weaker lanes from F1-10 and CHO cells. (C) EGF-induced calcium response in F1-10 and A431 cells measured with Fura-2 Ca2+-indicator.

