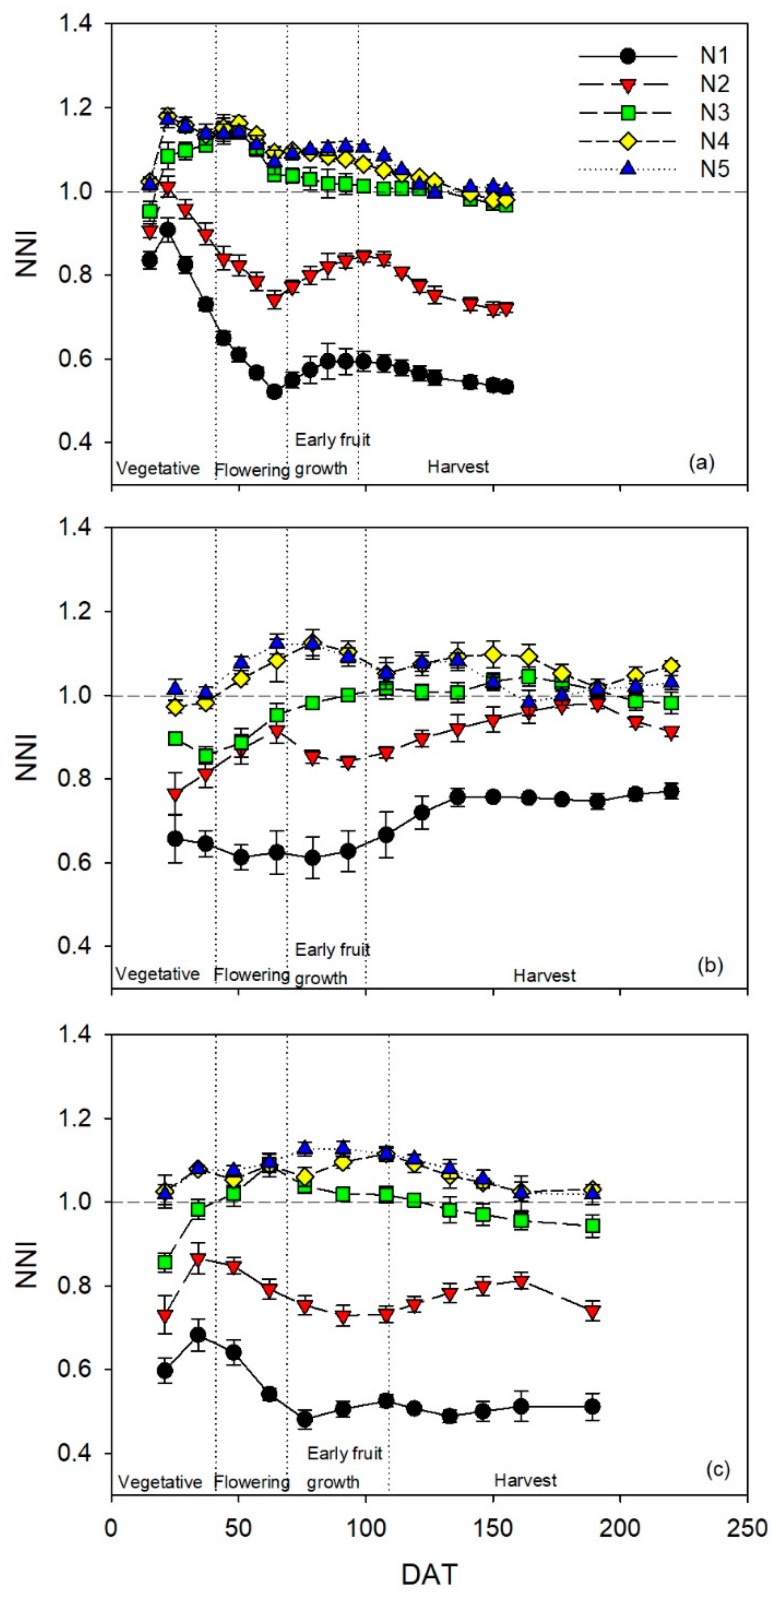
Figure 1.
Temporal dynamics of the nitrogen nutrition index (NNI) for the sweet pepper (Capsicum annuum) crops in the (a) 2014, (b) 2016, and (c) 2017 crops, subjected to five different N treatments with four repetitions. Values are means (n = 4) ± standard error (±SE). DAT is days after transplanting. Vertical dotted lines represent the different phenological stages; the horizontal dotted line indicates NNI = 1.

