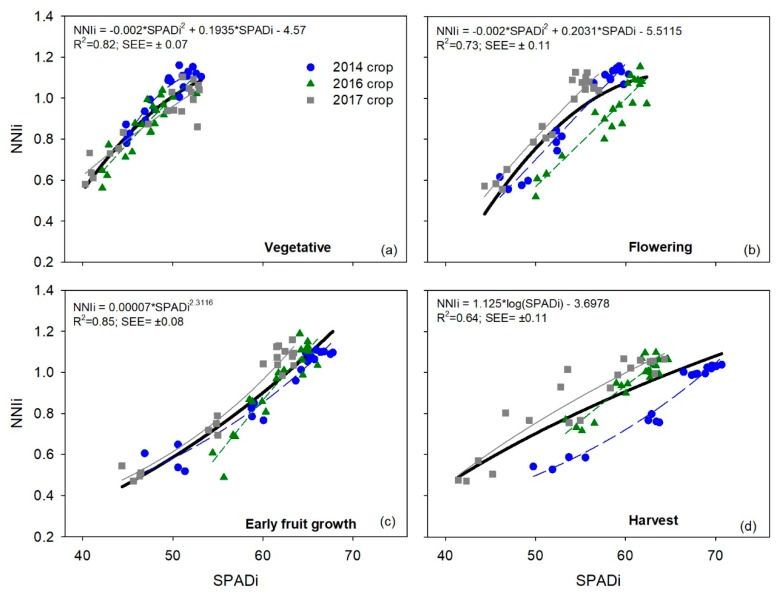
Figure 3.
Relationships between integrated SPAD (SPADi) values and the integrated crop nitrogen nutrition index (NNIi) for each phenological stage in each of the three sweet pepper (Capsicum annuum) crops. Each crop was subjected to five different N treatments with four repetitions. The bold black line and the equation represent the adjustment for the combined dataset of the three crops together. Results of regression for each crop separately are in Table 6.

