Figure 4.
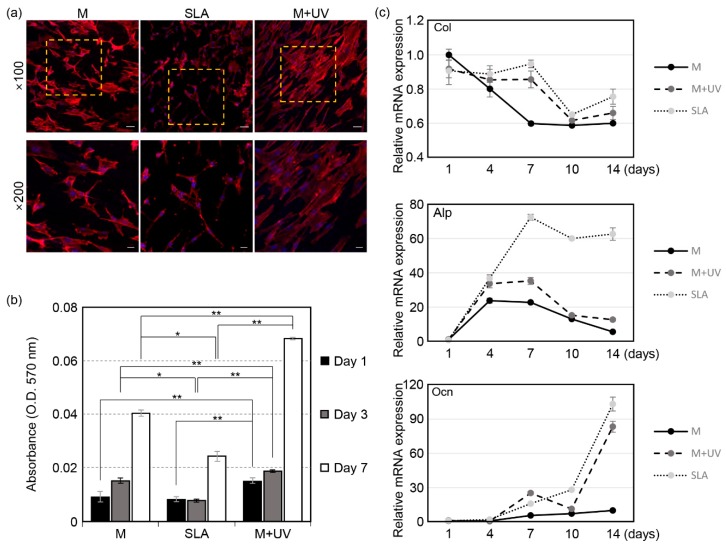
(a) Confocal microscopic images of the MC3T3-E1 cells, 24 h after being seeded on the Ti discs. The areas in the dotted box are magnified in the bottom row. Scale bars: 50 μm at ×100 and 20 μm at ×200 magnification. (b) Evaluation of cell proliferation of the MC3T3-E1 cells by an MTT assay at 1, 3, and 7 days after being seeded on the Ti discs. (c) Evaluation of the cell differentiation of MC3T3-E1 cells by real-time PCR at 1, 4, 7, 10, and 14 days after being seeded on the Ti discs. The relative mRNA expression levels were normalized to glyceraldehyde-3-phosphate dehydrogenase (GAPDH). The osteogenic markers are type I collagen (top), alkaline phosphatase (ALP, middle), and osteocalcin (OCN, bottom). UV photofunctionalization enhanced the osteoblastic gene expression. Error bars show the standard deviation. (*) and (**) represent the significance compared with each pair, p < 0.05 and p < 0.01, respectively.

