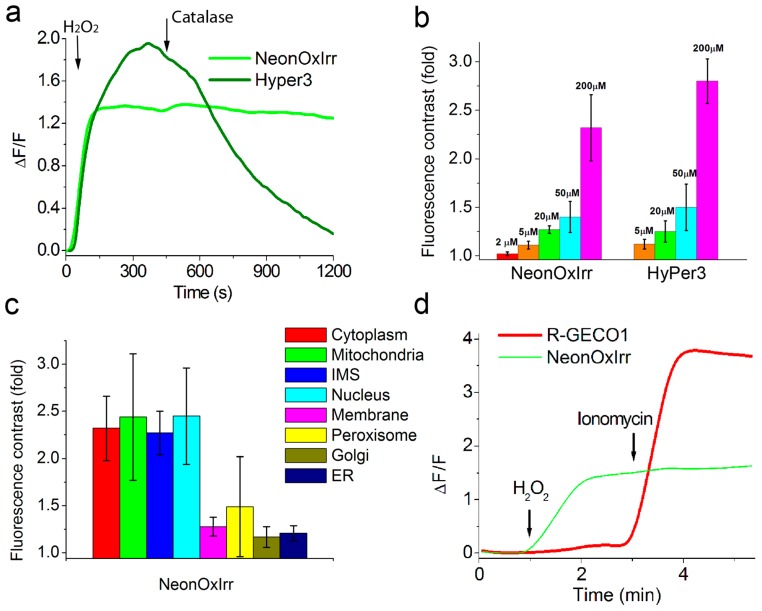
Figure 2.
Response of NeonOxIrr to external H2O2 in the cytoplasm and organelles of live HEK293T cells. (a) Dynamics of sensor reactions to the addition of a saturating 200 µM concentration of H2O2 averaged across 10 cells (two cultures). Times of the addition of H2O2 (200 µM final) and catalase (5 µg/mL final) are shown with arrows. Dynamics of fluorescence changes were extracted from the series of images acquired on confocal microscope. (b) Dependence of maximally achievable contrasts of the NeonOxIrr and HyPer3 indicators from the final concentration of external H2O2. (c) Contrasts of the NeonOxIrr indicator expressed in different compartments of live HEK293T cells. Contrasts correspond to a 200 µM final concentration of H2O2. (d) Simultaneous two-color imaging of H2O2 and calcium transients in HeLa cells. Averaged response of NeonOxIrr indicator to H2O2 (200 µM final concentration) related to 2.5 µM ionomycin-induced calcium response of the established R-GECO1 indicator. Error bars are SD.

