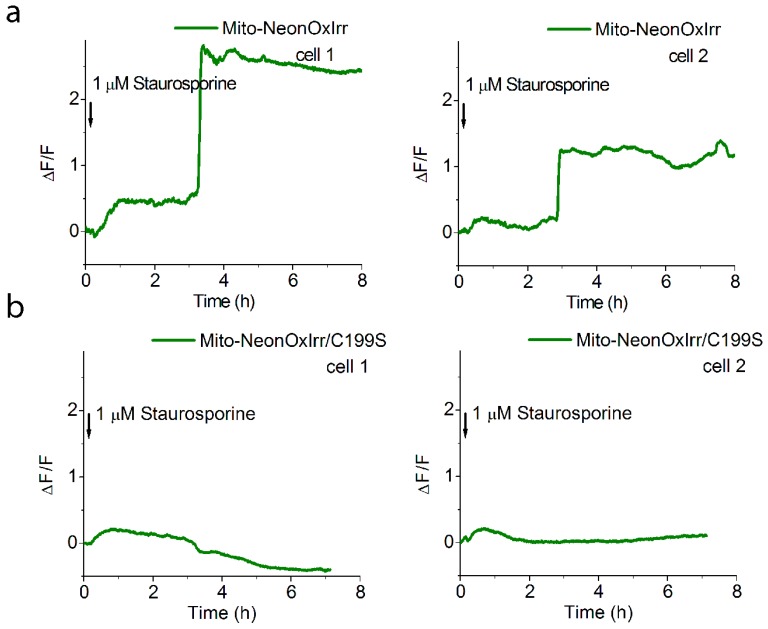
Figure 4.
Response of NeonOxIrr to staurosporine-induced endogenous H2O2 production in the lumen of mitochondria in live HeLa cells. (a) Dynamics of green fluorescence of the NeonOxIrr indicator to the addition of staurosporine (1 µM). The responses for three cells from one cell culture are shown. (b) Dynamics of green fluorescence of the NeonOxIrr/C199S indicator (with blocked sensitivity to H2O2) to the consecutive addition of staurosporine (1 µM). The responses for three cells from one cell culture are shown. The time of the staurosporine addition is shown with an arrow. Fluorescence was normalized to the 100% maximal fluorescence achieved for NeonOxIrr after the H2O2 addition. Dynamics of the fluorescence changes were extracted from a series of images acquired using a confocal microscope.

