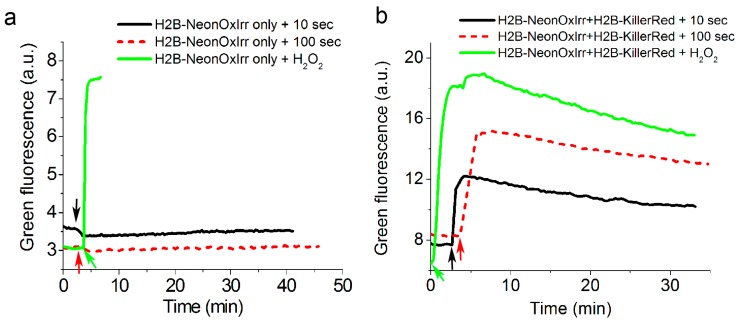
Figure 5.
Comparison of the responses of the green NeonOxIrr indicator to external H2O2 and optogenetic reactive oxygen species (ROS) generated by KillerRed red fluorescent protein that is co-expressed with an indicator in the nucleus of live HEK293T mammalian cells. (a) Response of the H2B-NeonOxIrr indicator expressed in the nucleus of HEK293T cells to H2O2 (green arrow) and yellow light (545/30 nm excitation light power of 3.1 mW/cm2 before 60x objective lens) illumination for 10 (black arrow) and 100 s (red arrow). (b) Response of H2B-NeonOxIrr co-expressed with H2B-KillerRed in the nucleus of HEK293T cells to H2O2 (green arrow) and yellow light illumination for 10 (black arrow) and 100 s (red arrow). Black and red plots illustrate changes of green fluorescence for the NeonOxIrr indicator in the nucleus upon illumination with yellow light for 10 and 100 s, respectively. Green graphs show reactions of the NeonOxIrr indicator to external H2O2 (200 µM final concentration). The time dependences of green fluorescence were extracted from a time-lapse series of fluorescent confocal images of HEK293T cells.

