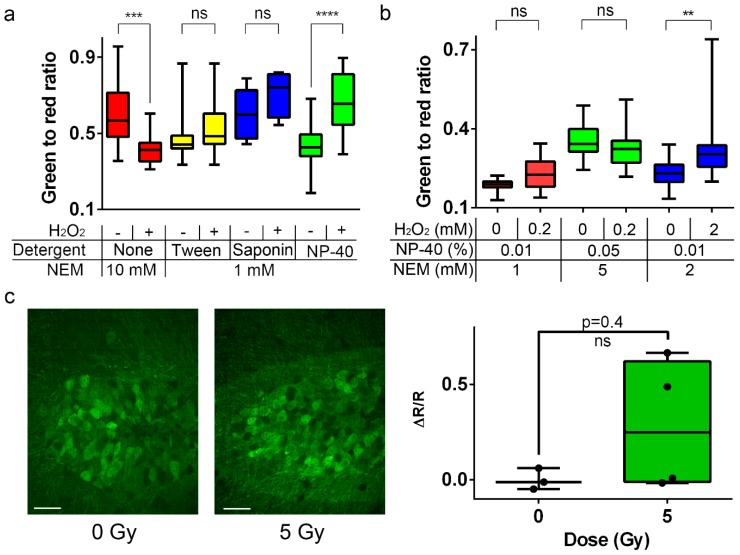
Figure 7.
Ex vivo detection of external H2O2 or γ-irradiation-induced ROS on neuronal cultures and mouse brain cortex and hippocampus using NeonOxIrr-P2A-mCherry indicator and NEM with detergents. (a) Ex vivo dependence of the H2O2-induced contrast of the NeonOxIrr-P2A-mCherry indicator in neuronal cultures. Various detergents have been added during the alkylation with NEM, which was followed by fixation with PFA. The green fluorescence of the NeonOxIrr-P2A-mCherry indicator normalized to the red fluorescence of mCherry (ratio 488/561) in neuronal cultures (DIV 16) after alkylation with 10 or 1 mM NEM in the presence of 0.1% Saponin, 0.01% NP−40, or 0.1% Tween−20 and subsequent fixation with 4% PFA. The cultures were pre-incubated with external 200 μM H2O2 or without H2O2 for 5 min. The corresponding contrasts are shown on the 4th day after the alkylation-fixation procedure. (b) Ex vivo detection of the NeonOxIrr-P2A-mCherry indicator response to external H2O2 in the mouse cortex. The averaged values of green fluorescence normalized to the red fluorescence (ratio 488/561) are shown for neuronal cells from confocal images of mouse brain slices without the injection of H2O2 and with the injection of 0.2 or 2 mM H2O2. Brain slices were obtained after the extraction of brains from perfused animals. Perfusion of slices pre-alkylated with 1, 2, or 5 mM NEM for 10 or 40 min (the last two green bars) was performed with 4% PFA. Immediately prior to alkylation-perfusion, 0.2 mM or 2 mM H2O2 was injected into only one of the two regions infected with rAAV particles bearing NeonOxIrr-P2A-mCherry. Images of brain slices were obtained on the first or second day after fixation. (c) Ex vivo detection of the NeonOxIrr-P2A-mCherry indicator response 16 h after 5 Gray γ-irradiation in the hippocampus of the mice brain. Confocal images of brain hippocampal slices transduced with rAAV-CAG-NeonOxIrr-P2A-mCherry viral particles are shown for the control mice (0 Gy dose) and 5 Gy γ-irradiated mice (panel c, left). Scale bar—30 µm. ΔR/R values are shown for the neuronal cells from confocal images of slices of mouse hippocampus regions without and with 5 Gy γ-irradiation. Mean values of the green fluorescence were normalized to the red fluorescence (R, ratio 488/561). Brain slices were obtained after the extraction of brains from perfused animals. Perfusion of slices pre-alkylated with 1 mM NEM for 10 min was performed with 4% PFA 16 h after irradiation. The box extends from the 25th to 75th percentiles. The line in the middle of the box is plotted at the median. The whiskers go down to the smallest value and up to the largest.

