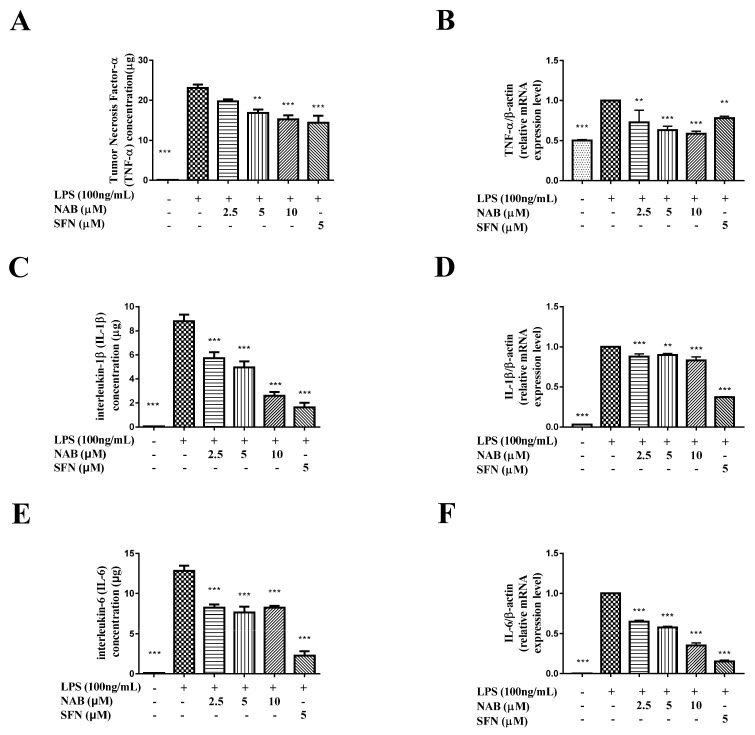
Figure 6.
The effect of NAB on the production of TNF-α, IL-1β, and IL-6 in LPS-activated RAW264.7 cells. Effects of NAB on the expression level of TNF-α (A,B), IL-1β (C,D), and IL-6 (E,F) in LPS-stimulated RAW264.7 cells. Cells were pretreated with NAB or positive control drug (sulforaphane, SFN) for 1 h and then stimulated with LPS (100 ng/mL) for 18 h. Total mRNA was prepared, and the mRNA expression of TNF-α, IL-1β, and IL-6 was detected. Culture medium was collected, and ELISA was used to measure the expression level of TNF-α, IL-1β, and IL-6. In the qRT-PCR analysis, the density ratio of the LPS group (model control) was set to 1. In the ELISA analysis, the variances were compared with the LPS group. Results are expressed as mean ± SEM of three independent experiments. ** P < 0.01 and *** P < 0.001 vs. LPS-stimulated cells.

