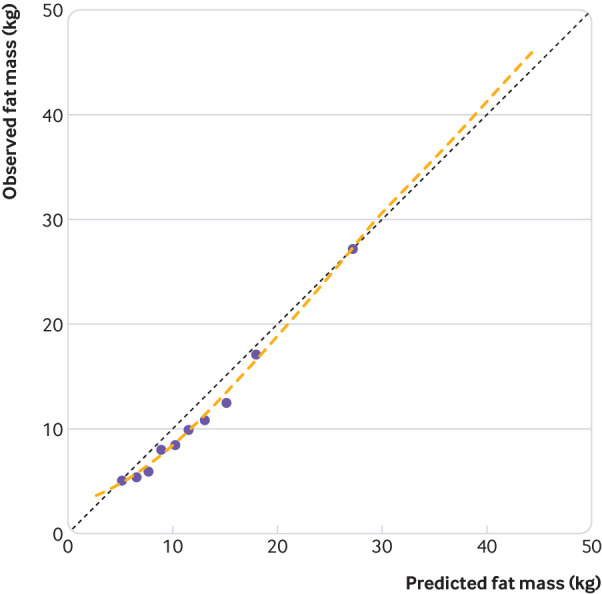
Fig 3.

Calibration plot of mean observed against mean predicted values, across 10ths of predicted fat mass, from external validation before recalibration of intercept. Data points are mean predicted against mean observed fat mass within 10ths of predicted fat mass. Individual level data points not shown for confidentiality reasons. Broken orange line represents a local regression smoother through individual level data points. Broken black line represents line of equality
