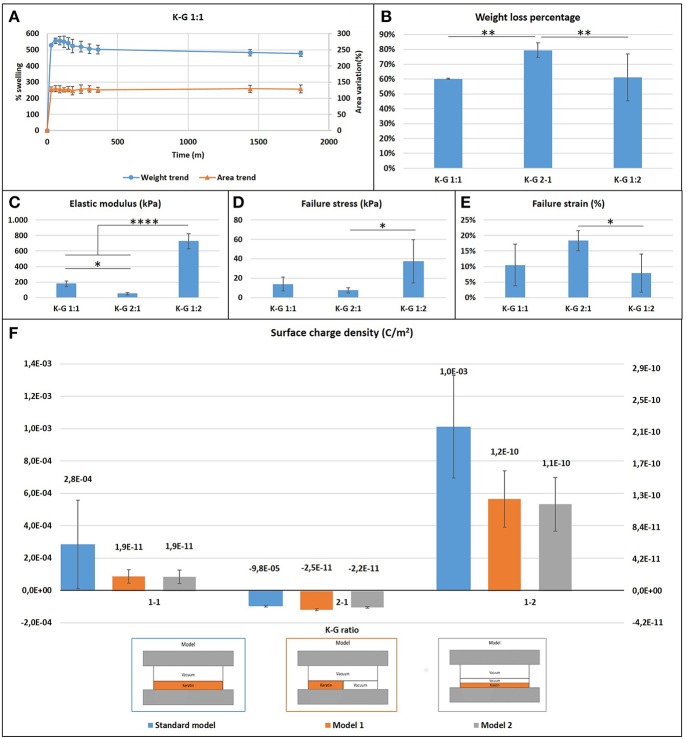
Figure 3.
(A) Casted samples K:G 1:1 swelling trend for weight and area (samples K:G 1:2 and K:G 2:1 showed a similar trend); (B) Weight loss percentage; Tukey's multiple comparisons test **p < 0.007; (C) Elastic modulus trend; *p < 0.02, ****p < 0.0001; (D) Failure stress trend; *p < 0.02; (E) Failure strain trend; *p < 0.04; (F) Surface charge density for three different model.

