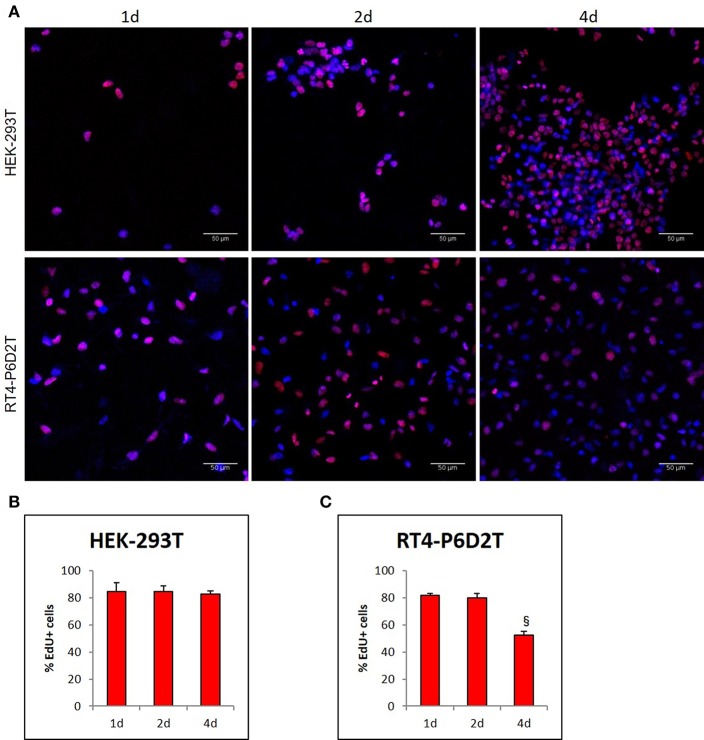
Figure 7.
(A) Representative images of EdU staining in HEK-293T and RT4-D6P2T cells after 1, 2 and 4 days of culture on keratin based structure; (B,C) Histograms representing the percentage of HEK-293T (B) and RT4-P6D2T (C) EdU positive cells/total cells. Hoechst was used for nuclear staining. §P < 0.05 vs. 2d. Scale bar is 50 μm.

