Figure 2.
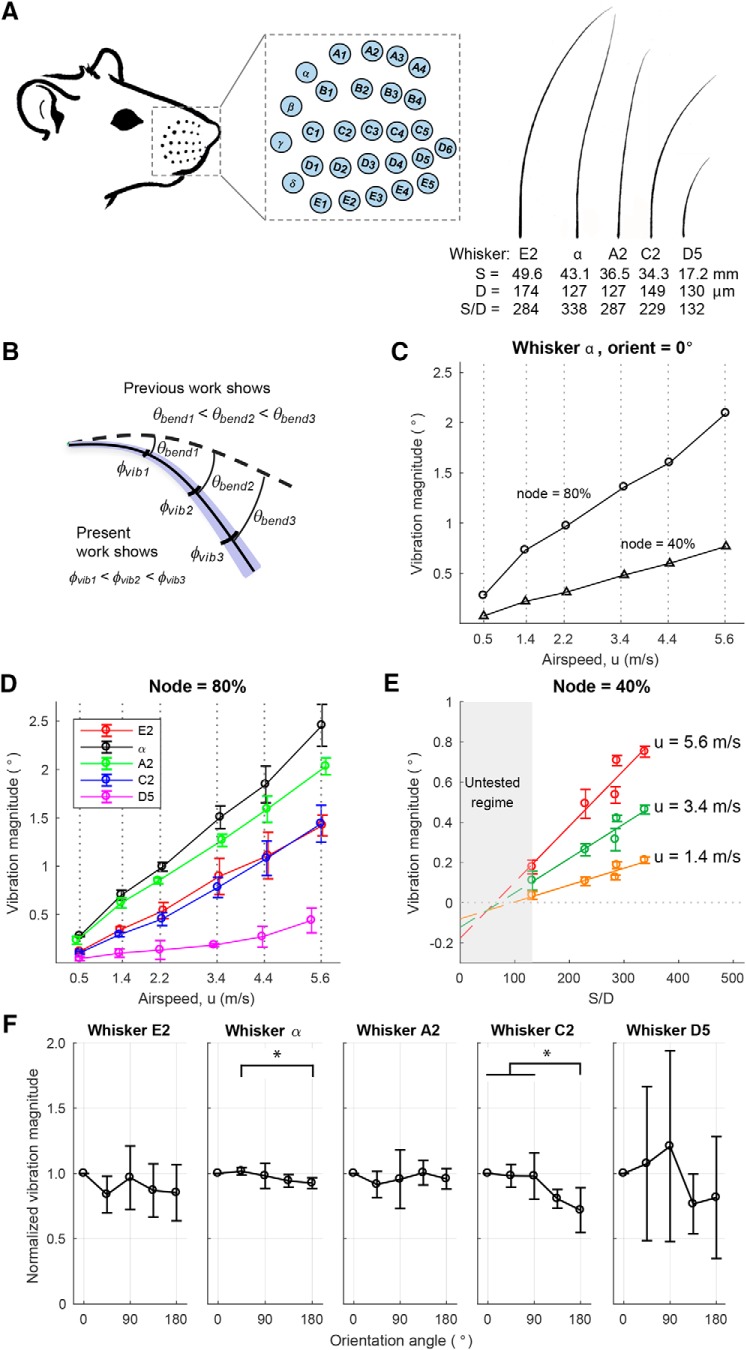
Vibration magnitude varies with airspeed and whisker geometry. A, Left, Drawing of a rat and mystacial pad with whisker basepoints highlighted as cyan dots. Drawing adapted from Belli et al. (2018). These whisker basepoints are expanded in the inset to show their identities. Right, Five whiskers with different S/D ratios were used in the experiments. A lower S/D ratio means that the whisker is stiffer compared with a whisker of the same length with a higher S/D ratio. Manual tracings of the scanned whiskers are shown. B, Schematic of bending and vibration magnitudes. Dashed curve indicates the position of the whisker at rest (no airflow). Solid curve indicates the mean position of the whisker in the presence of airflow. Blue transparent region schematizes vibration magnitude around the static bending. θbend and φvib indicate bending magnitude and vibration magnitude, respectively. For all whiskers in all conditions, we found that φvib1 < φvib2 < φvib3. C, Vibration magnitude is larger at more distal locations along the whisker. The plot represents the vibration magnitude of nodes located at 40% and 80% along the whisker α. In this example, the whisker was oriented concave forward into the airflow, but similar results held for all whiskers at all orientations. D, Vibration magnitude increases linearly with airspeed. Results are shown for nodes 80% out along the whisker length and averaged over all orientation angles (mean ± SD). E, Vibration magnitude increases approximately linearly with the S/D ratio of the whisker. Along the x axis, ordered from small to large S/D ratio, the whisker identities are D5, C2, E2, A2, and α. Results are shown for a node 40% out along each whisker and at airspeeds of 1.4, 3.4, and 5.6 m/s (mean ± SD at five orientations). Linear fits between vibration magnitude and S/D ratio show increasing slopes with airspeed. Because airspeeds were not identical for all five whiskers, values of vibration magnitude have been interpolated between the airspeeds closest to the speed of interest. F, The whisker's orientation relative to airflow did not strongly contribute to vibration magnitude. In each subplot, the vibration magnitude has been normalized by that whisker's vibration magnitude at orientation angle 0° (concave forwards, toward the airflow). Only the α whisker (F(4,25) = 3.12, p = 0.0329) and the C2 whisker (F(4,25) = 6.63, p = 0.0009) showed significant changes in vibration magnitude due to orientation (one-way ANOVA with repeated measures). Tukey's post hoc testing indicates that only 4 of 50 pairs of group comparisons show a significant difference: for the α whisker, only the vibration magnitude at 180° is significantly lower than the one at 45° (p = 0.0458); and for the C2 whisker, the vibration magnitude at 180° is significantly lower than the ones at 0° (p = 0.0039), 45° (p = 0.0073), and 90° (p = 0.0079). *p < 0.05. Results show mean ± SD at six airspeeds for a node 40% out along each whisker.

