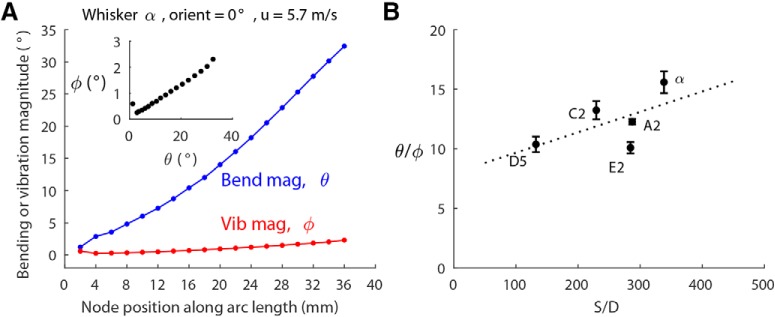
Figure 3.
Vibration magnitude scales with bending magnitude. A, Bending magnitude and vibration magnitude along the arc length of the α whisker with orientation angle 0° and airspeed 5.7 m/s. Inset, Vibration magnitude versus bending magnitude for all the nodes of the α whisker. B, The ratios of bending magnitude to vibration magnitude (θbend/φvib) of all five whiskers fall within a range of 10–16, and slightly increase with the S/D ratio. Dashed line indicates the line of linear regression over the five means. Data show mean ± SEM over all whisker nodes at all velocities and all orientation angles.

