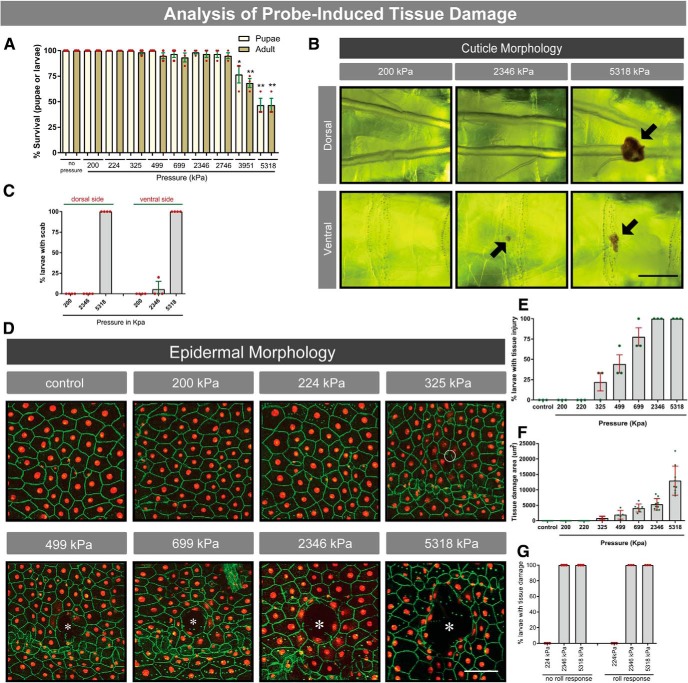
Figure 2.
Survival and tissue damage analysis induced by mechanical stimulation. A, Larval survival in response to increasing pressure. Yellow bars represent pupae. Brown bars represent adults. B, Live whole mounts of third instar larvae probed with the indicated pressures at dorsal segment A8 and viewed by light microscopy. Black arrows indicate melanized scabs. Scale bar, 250 μm. C, Percentage of larvae developing melanized scabs on the dorsal and ventral sides. D, Dissected whole mounts of third instar larvae with fluorescently labeled epidermis probed at dorsal segment A8 with indicated pressures. Red represents epidermal nuclei. Green represents epidermal cell membranes. Dark areas (white asterisks) represent epidermal gaps. White circle represents broken epidermal membrane. Scale bar, 100 μm. Percentage of open wounds (E) and area of epidermal damage (F) after mechanical stimulation (E,F; n = 9 animals for each condition). G, Percentage of larvae that showed tissue damage, probed at dorsal segment A8 with the indicated pressures, that did or did not exhibit a nociceptive behavioral response. Error bars indicate mean ± SEM. Two-tailed unpaired t test was used for statistical analysis: *p < 0.05; **p < 0.01.

