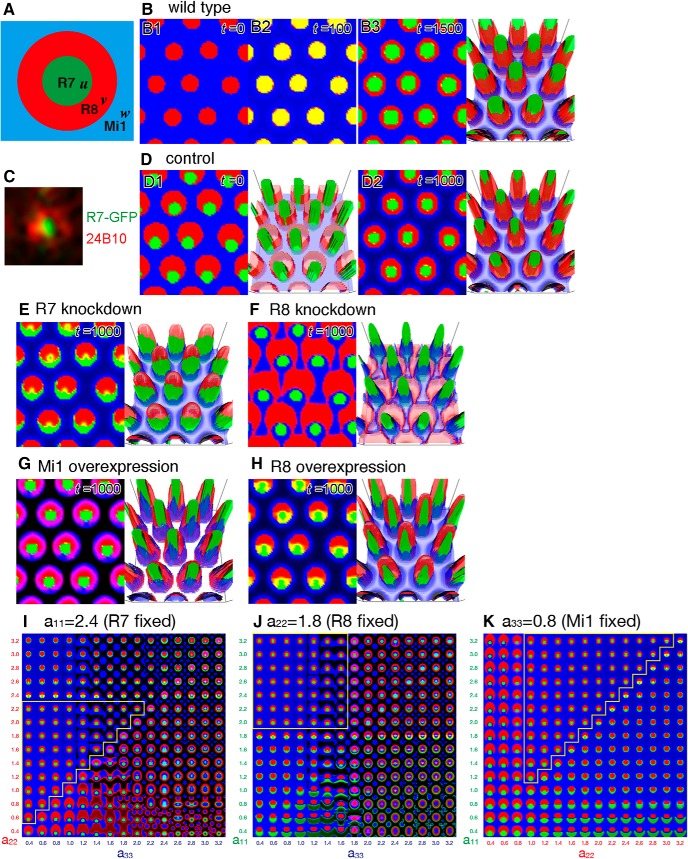
Figure 10.
The continuous mathematical model of column formation. A, Schematic of the configuration of a column in the control. The variables u, v, and w are the densities of the terminals of R7 (green), R8 (red), and Mi1 (blue), respectively. B, Numerical results of sequential projections of R8 (B1; t = 0) and R7 (B2; t = 100). Identical initial distributions of R8 and R7 produce clear concentric patterns of R7, R8, and Mi1 (B3; t = 1500). C, Segregated distribution patterns of PM181-Gal4 UAS-myrGFP (green) and 24B10 (red) just below the lamina before the arrival at the medulla, where R8 partially engulfs R7. D–H, Results of numerical simulations based on the initial distribution pattern shown in D1. D1, D2, Control (a11 = 2.4, a22 = 1.8, a33 = 0.8). R7, R8, and Mi1 are clearly segregated (D2; t = 1000). E, R7 knockdown (a11 = 1.7). R7 is excluded from the ring of R8 and partially enwraps R8 (t = 1000). F, R8 knockdown (a22 = 0.6). R8 is expanded and fuses with the neighboring columns (t = 1000). G, Mi1 overexpression (a33 = 1.8). Mi1 penetrates the ring of R8 (t = 1000). H, R8 overexpression (a22 = 2.4). R8 and R7 are expanded toward the column center and column periphery, respectively (t = 1000). B3, D1, D2, E–H, Right panels, 3D views of the results, in which z axis indicates the density of neurites. I–K, The adhesiveness of R7, R8, and Mi1 (a11, a22, and a33) is changed between 0.4 and 3.2 to examine the range of parameter settings by which the normal column pattern can be reproduced. I, a11 is fixed to 2.4. J, a22 is fixed to 1.8. K, a33 is fixed to 0.8. Normal concentric columnar patterns are obtained if the order of adhesiveness is conserved (yellow lines; a11 > a22 > a33).

