Figure 6.
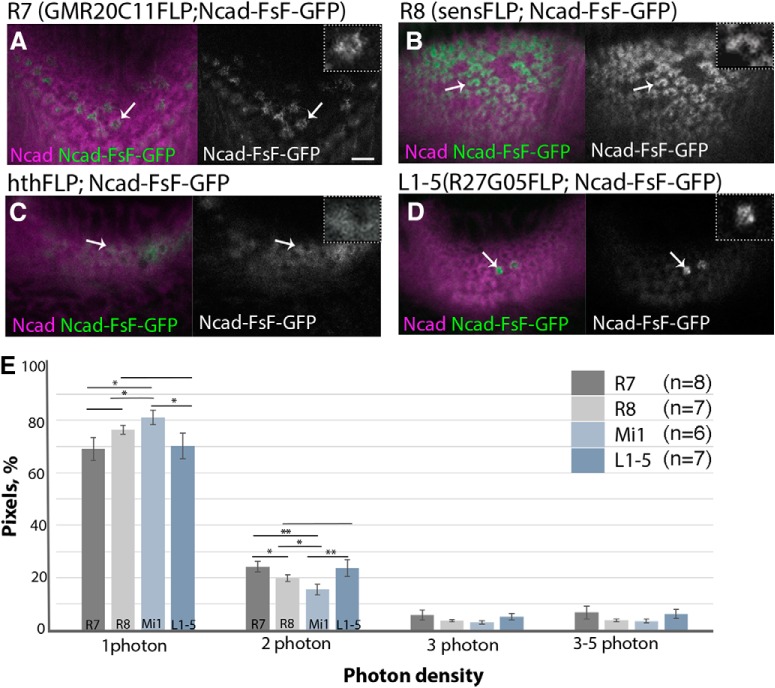
Differential expression of N-cadherin in the columnar neurons. Ncad protein localized at the terminals of columnar neurons are visualized by combining Ncad-FsF-GFP (green or white) and FLPase strains that are specific to R7 (A), R8 (B), Mi1 (C), and L1–L5 (D) in L3 larval medulla. Magenta represents Ncad. A, Ncad-GFP is visualized in R7 under the control of R20C11-FLPG5. Ncad-GFP exists in the central hole area inside the columns (arrows). B, Ncad-GFP is visualized in R8 under the control of sens-FLPG5. C, Ncad-GFP is visualized in Mi1 under the control of hth-FLP. Mi1 was identified by Bsh expression. D, Ncad-GFP is visualized in L1–L5 under the control of R27G05-FLPG5 (arrows). Higher-magnification images are separately visualized in the top right corner of each panel. Scale bar: A, 5 μm. E, Densities of photons that derive from Ncad-GFP at the terminals of columnar neurons are compared in L3 larval brains. Histogram of photon densities at the terminals of R8, R7, Mi1, and L1–L5. Percentages of pixel areas that contain 1, 2, 3, and 3–5 photons are compared for each neuron type. Number of axon terminals examined: R8 (n = 7), R7 (n = 8), Mi1(n = 6), L1–L5 (n = 7). *p < 0.05 (t test). **p < 0.01 (t test).

