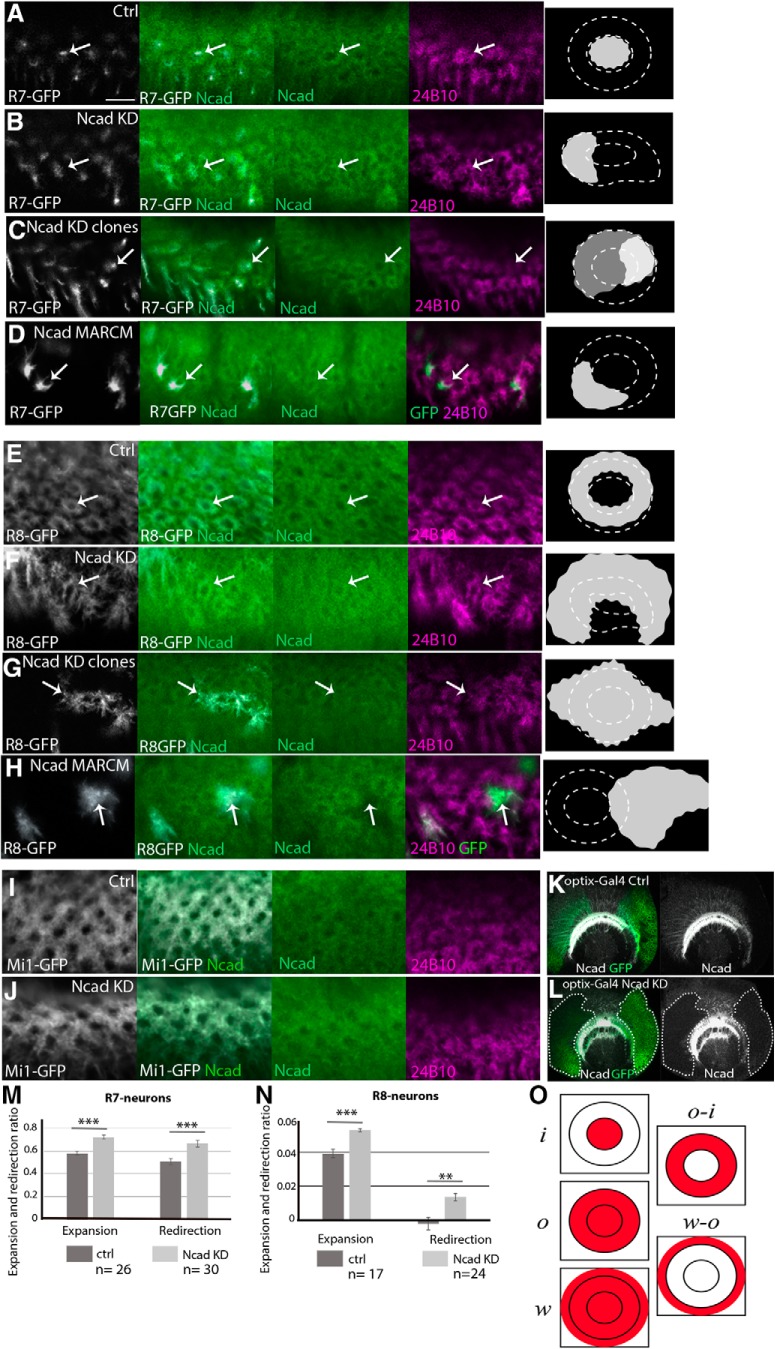
Figure 7.
Roles of N-cadherin in columnar organizations. Columnar Ncad pattern (green), and projection patterns of R axons (24B10; magenta) and columnar neurons (UAS-myrGFP; white) in WT and Ncad knockdown backgrounds in L3 larval medulla. A–D, R7 terminals visualized by PM181-Gal4. A, Control. B, Ncad RNAi in R7. R7 terminals are expanded and the columnar Ncad pattern is disorganized (arrows). C, Ncad RNAi in a subset of R7 under the control of R20C11-FLPG5; GMR>Gal80>Gal4. R7 terminals are expanded and redirected to the column periphery (arrows) as quantified in M. D, Ncad mutant MARCM clones visualizing R7 terminals that are expanded and redirected to the periphery of the column (arrows). E–H, R8 terminals visualized by sensF2-Gal4. E, Control. F, Ncad RNAi in R8. R8 terminals are expanded and the columnar Ncad pattern is disorganized (arrows). G, Ncad RNAi in a subset of R8 under the control of sens-FLPG5; GMR>Gal80>Gal4. R8 terminals are expanded and redirected to the column periphery (arrows) as quantified in N. H, Ncad mutant MARCM clones visualizing R8 terinals that are expanded to the column periphery (arrows). Ncad staining is abolished in and around the mutant clones (arrows). I, J, Mi1 terminals visualized by bshM-Gal4. I, Control. J, Ncad RNAi in Mi1. Mi1 terminals and columnar Ncad pattern are not significantly affected. Scale bar: A, 5 μm. K, L, The effect of UAS-Ncad RNAi (BDSC27503) on Ncad protein level was tested by using optix-Gal4 UAS-CD8GFP (green) in larval medulla. Ncad (white). K, Control. L, Ncad signal is significantly downregulated in GFP-positive area indicated by white dotted lines. M, N, Expansion and redirection ratios of R7 (M) and R8 (N) are quantified according to the definition in O. **p < 0.01 (t test). ***p < 0.001 (t test). O, o and i indicate the total GFP amount within the outer and inner rings of Ncad or phalloidin staining, respectively. w indicates the total GFP amount within the entire growth cone of a single R8 axon. Relative GFP density (R7 and Mi1) or amount (R8) between distinct domains was used to calculate the expansion and redirection ratios. Details are described in Materials and Methods.

