Figure 8.
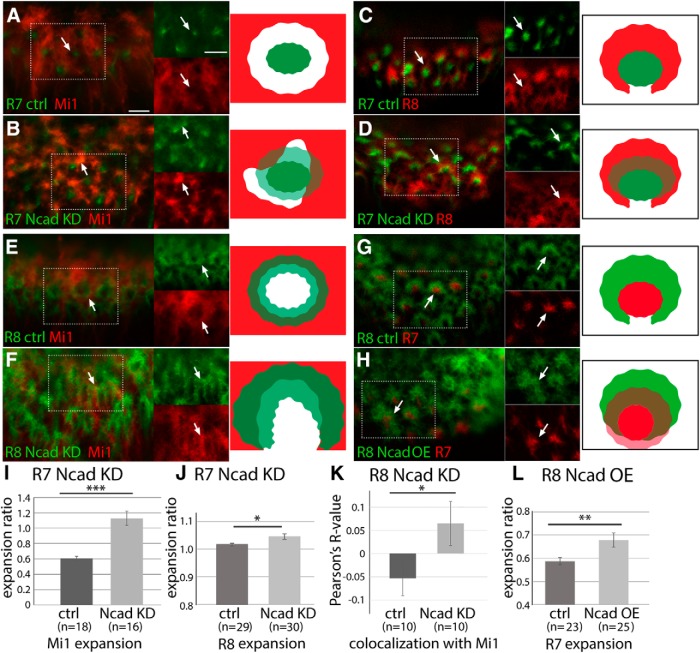
Ncad knockdown reveals differential adhesion between columnar neurons. Influences of Ncad RNAi expression in columnar neurons on other neurons in L3 larval medulla. A–D, R7 terminals are visualized by PM181-Gal4 UAS-myrGFP (green). A, B, Mi1 terminals are visualized by bshM-LexA LexAop-myrTomato (red). A, Control. R7 and Mi1 terminals do not overlap each other (arrows). B, Ncad RNAi in R7. R7 terminals are expanded and Mi1 terminals are disorganized. R7 and Mi1 overlap each other as evident from yellow signals (arrows) as quantified in I. C, D, R8 terminals are visualized by sensF2-LexA LexAop-myrTomato (red). C, Control. R7 terminals are enwrapped by R8 terminals (arrows). D, Ncad RNAi in R7. R7 and R8 overlap each other as evident from yellow signals (arrows) as quantified in J. E–H, R8 terminals are visualized by sensF2-Gal4 UAS-myrGFP (green). E, F, Mi1 terminals are visualized by bshM-LexA LexAop-myrTomato (red). E, Control. R8 and Mi1 terminals are adjacent with each other. F, Ncad RNAi in R8. R8 terminals are expanded and Mi1 terminals are disorganized (arrows). R8 and Mi1 overlap each other as quantified in K. G, H, R7 terminals are visualized by sevEnS-LexA LexAop-myrTomato (red). G, Control. R7 terminals are enwrapped by R8 terminals. H, Ncad overexpression in R8. R7 terminals are expanded toward the column center and overlap with R8 terminals as quantified in L. Rectangles indicated by white dots are separately shown at right (A–H). Scale bars: A, 5 μm. I–L, Expansion of Mi1 (I), R8 (J), and R7 terminals (L), and overlaps between R8 and Mi1 (K) are quantified and statistically tested. *p < 0.05 (t test). **p < 0.01 (t test). ***p < 0.001 (t test).

