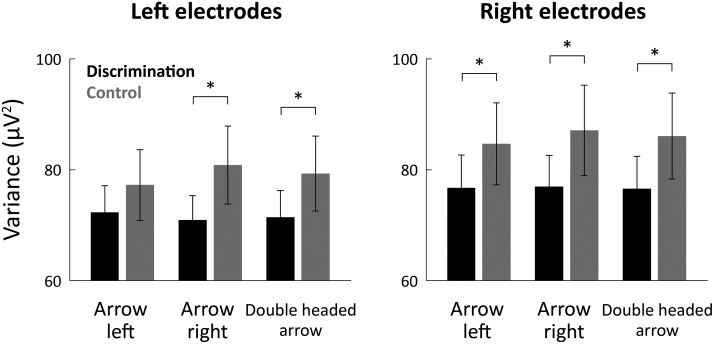
Figure 3.
Neural variability was significantly smaller in the orientation discrimination experiment. Mean trial-by-trial variability across subjects during the postcue time window (250–500 ms). Results are presented for each cue type (left, right, and double-headed) in the control (gray bars) and orientation discrimination (black bars) experiments. Neural variability was measured separately in the left (left panel) and right (right panel) electrodes. Error bars indicate SEM across subjects. *p < 0.05, significant differences across experiments (two-tailed t test).

