
Figure 7.
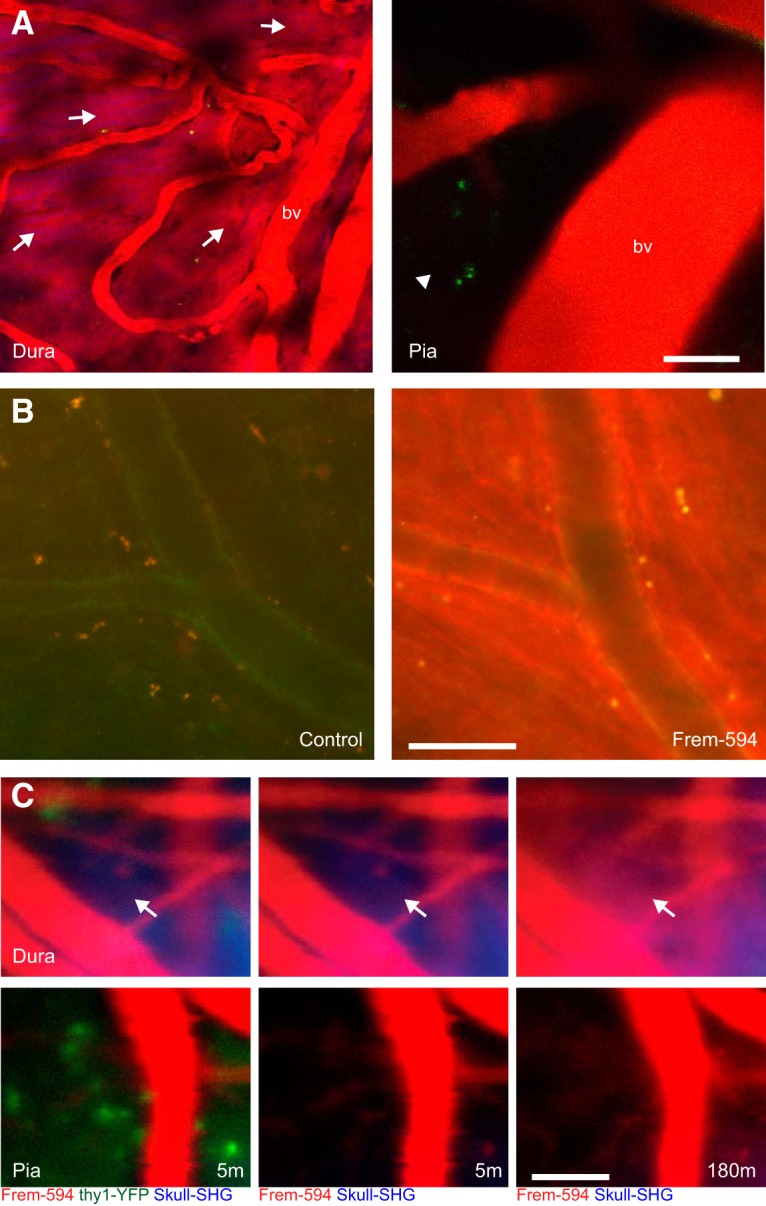
Presence of fremanezumab in the dura. A, In vivo images of the dura (left) and pia (right) of a rat 4 h after infusion with Alexa Fluor 594-conjugated fremanezumab (Fr594; representative of n = 2 rats). Labeled fremanezumab is indicated as red fluorescent areas (arrows) in the dura outside of blood vessels (bv). Note the lack of labeling outside of blood vessels in the pia (arrowhead). B, Fluorescent images of fixed dura removed from rats that did not undergo skull thinning and were injected with control nonfluorescent fremanezumab (left) or Fr594 (right; representative of n = 2 rats). C, In vivo images of a mouse expressing EYFP in the brain (thy1-EYFP), after injection with Fr594. The mouse scalp was cut, but the skull was not thinned. Images are shown at 5 m post injection (left and middle), with the EYFP channel displayed only in the left images, and at 180 m post injection (right) (representative of n = 2 mice). Note the presence of fremanezumab in the dura after 180 m (arrow) but not the pia or cortex. Scale bars: A–C, 50 μm.