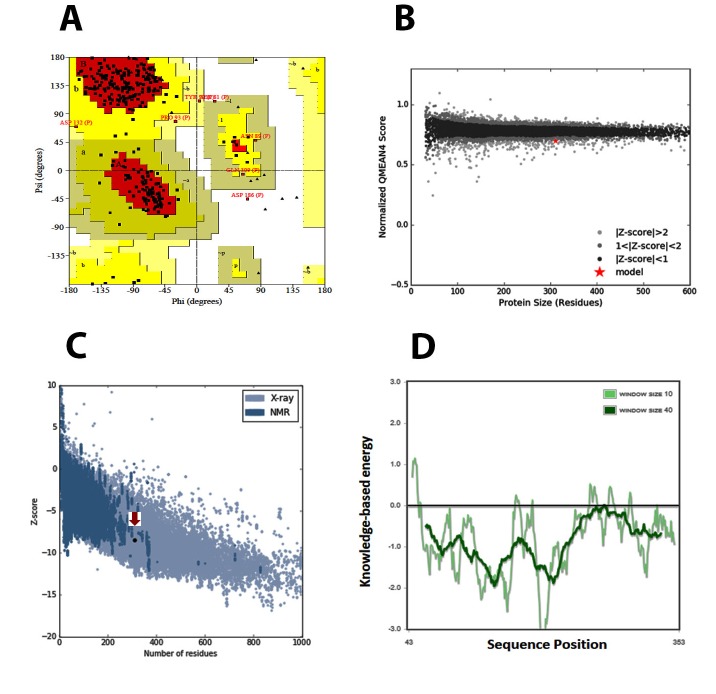
Figure 1.
(A) Validation of the x-ray crystallography structure of NF-κB1 by Ramachandran plot. (B) Qmean based structure validation, which compares the structure to a non-redundant set of PBDs of similar size. The NF-κB1 structure, indicated using a red star, lies within the range of scores of similar size structures, indicating its good quality. (C) ProSa Z-score plot of the NF-κB1 is indicated with a red arrow. (D) The local quality of the model is shown in a plot of energy as a function of amino acid sequence position.

