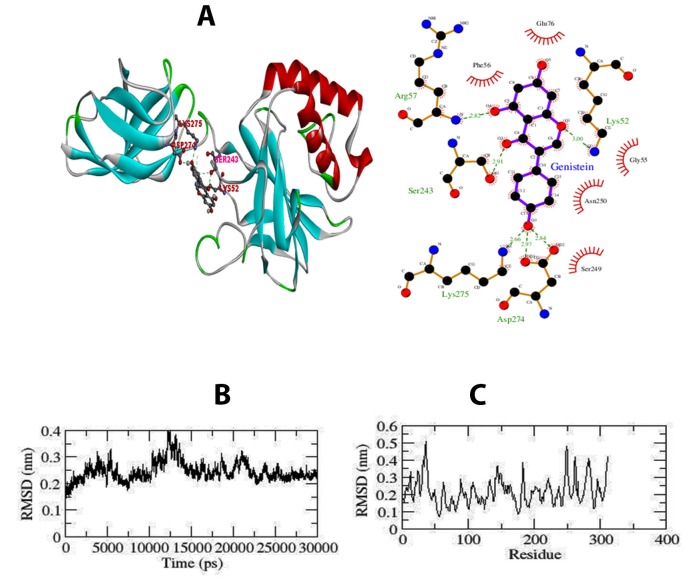
Figure 2.
(A) 2D ligand interaction diagram created by LigPlot+ showing the hydrogen bond network and the hydrophobic interactions of genistein with the NF-κB1. (B) Conformational stability of apo form of NF-κB1 throughout 30 ns time period. Backbone-RMSD of NF-κB1 (Black color: Apo form) (C) Cα-RMSF profile of apo form of NF-κB1 during 30 ns MD (Black color: Apo form).

