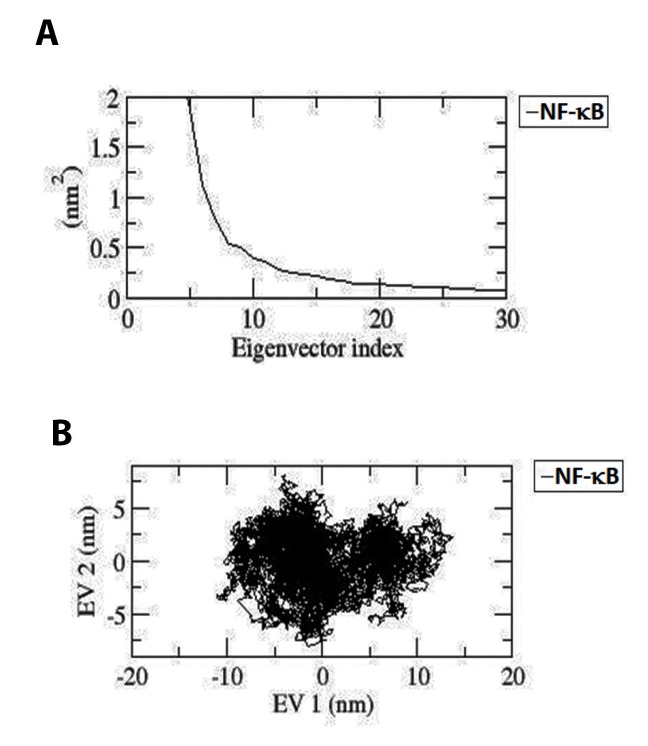
Figure 4.
(A) Principal component analysis. The eigenvalues plotted against the corresponding eigenvector indices obtained from the Cα covariance matrix constructed from the 30 ns MD trajectory. First 30 eigenvectors were used for calculations. (B): Projection of the motion of the apo form of NF-κB1 in phase space along the first two principal eigenvectors (EV1 and EV2). The cloud represents the projection of trajectories of eigenvectors (EV1 and EV2) (Black color: apo).

