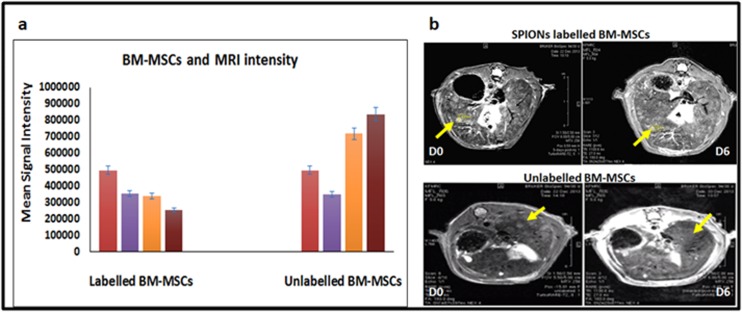
Figure 5.
ChartofMean signal Intensity of time course MR imaging demonstrating the homing of labelled and unlabelled BM-MSCs to the injured liver (a); Time course MRI performed on day 0 and day 6 after 2nd dose SPIONs labelled and unlabeled BM-MSCs showing the Axial T2 Turbo RARE images. Arrows indicate decreases in size of the nodules with varying intensity in labelled in unlabeled BM-MSCs respectively (b).

