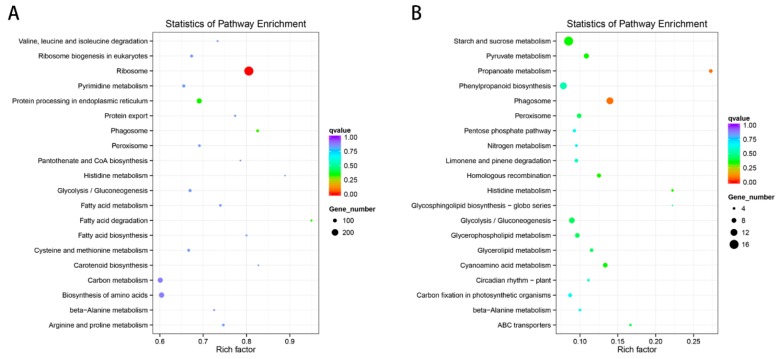
Figure 13.
The enriched KEGG pathway scatterplots of non-coding RNAs (ncRNAs) in the cultivar “Huoche” under heat stress. (A) and (B) KEGG enrichment of lncRNAs and miRNAs in “Huoche” under HS. The vertical axis represents the pathway name, and the horizontal axis represents the Rich factor. The size of the point indicates the number of differentially expressed genes in the pathway, and the color of the point corresponds to a different q-value range.

