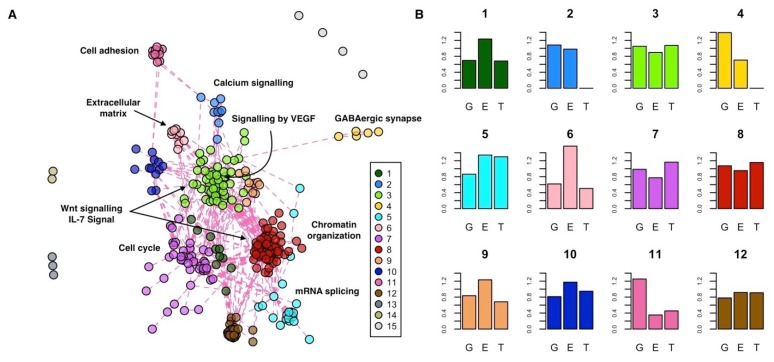
Figure 4.
Functional characterization of the INT-MODULE. (A) Topological clusters; #1–12: Clusters of the largest connected component; #13,14: Two clusters of three and two genes, respectively; #15: The remaining four genes. (B) Enrichment (vertical axis) of each cluster in terms of genes supported by genomics (G), epigenomics (E), and transcriptomics (T): A value of 1 indicates the same proportion within the cluster and in the whole INT-MODULE.

