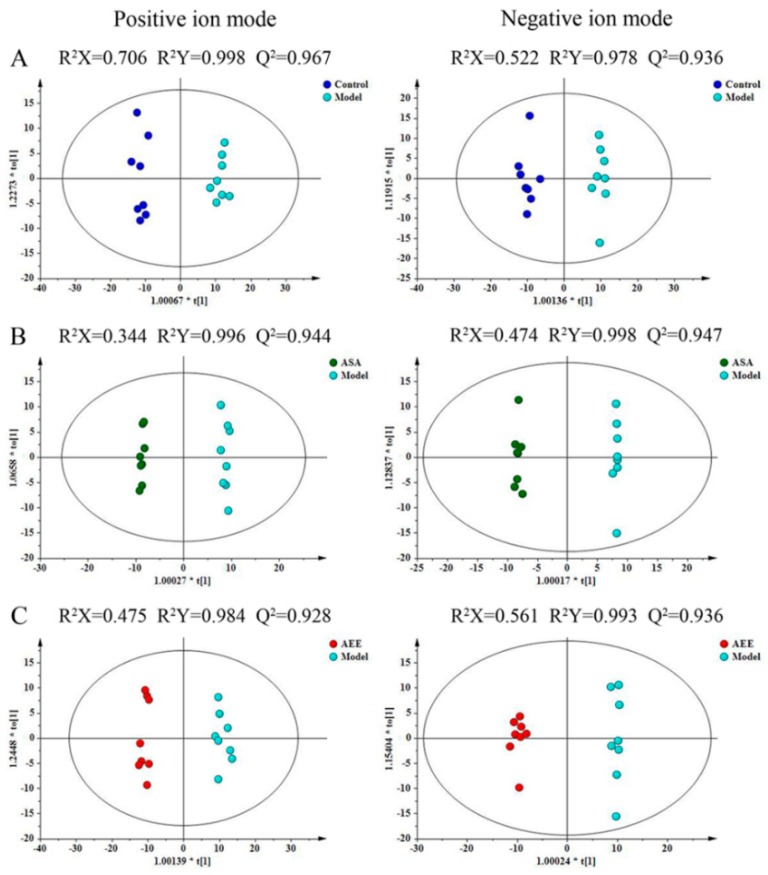
Figure 3.
The effect of AEE on the metabolomic profile of plasma from rats with blood stasis. The OPLS-DA score plots of different groups in positive and negative modes. (A) Control group versus model group, ESI+: R2X = 0.706, R2Y = 0.998 and Q2 = 0.967; ESI-: R2X = 0.522, R2Y = 0.978 and Q2 = 0.936. (B) ASA group versus model group, ESI+: R2X = 0.344, R2Y = 0.996 and Q2 = 0.944; ESI-: R2X = 0.363, R2Y = 0.995 and Q2 = 0.93. (C) AEE group versus model group, ESI+: R2X = 0.475, R2Y = 0.984 and Q2 = 0.928; ESI-: R2X = 0.494, R2Y = 0.976 and Q2 = 0.912.

