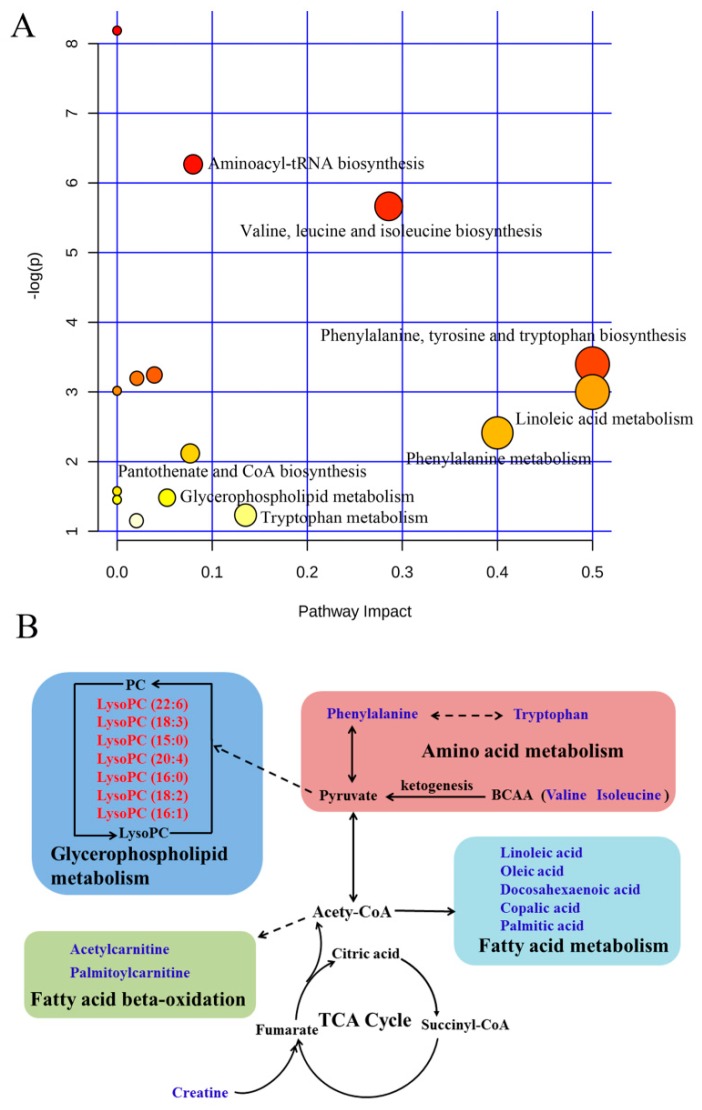
Figure 4.
Disturbed pathways in response to blood stasis and AEE treatment. (A) Summary of pathway analysis from MetaboAnalyst. All of the matched pathways are displayed as circles. The color and size of each circle are based on its -log (p) value and pathway impact value, respectively. The x-axis represents the pathway impact value that was calculated from the pathway topological analysis, and the y-axis represents the -log (p) value that was obtained from the pathway enrichment analysis. The metabolic pathway with a high pathway impact value and -log (p) value shows that the identified metabolites had a key position and influence on this pathway. (B) The potential metabolic network that was disrupted in rats with blood stasis and was altered by AEE treatment.

