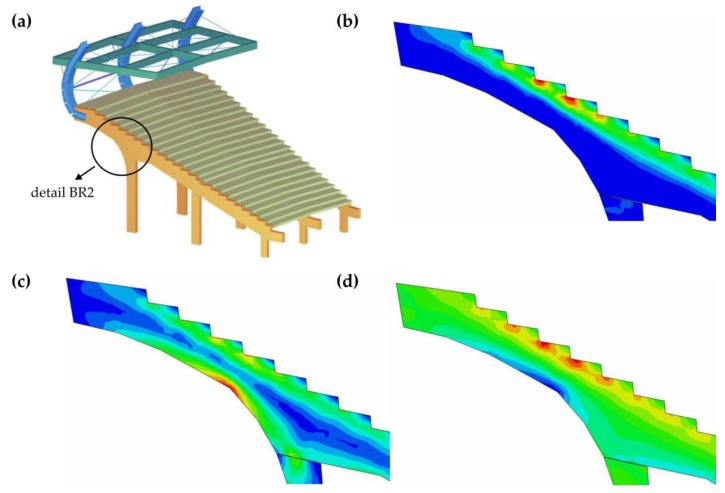
Figure 19.
(a) Placement of the highest stress concentrations in the main girder of the stadium stand. (b) von Mises map of stresses in the BR2-reinforced concrete girder area (red color—maximum stress equal to 10 MPa). (c) Map of the main tensile stresses within the BR2-reinforced concrete girder (red color—maximum tensile stress equal to 8 MPa). (d) Map of the horizontal normal stress s11 within the BR2-reinforced concrete girder (red color—maximum tensile stress equal to 8 MPa, blue color—maximum compressive stress equal to 8 MPa).

