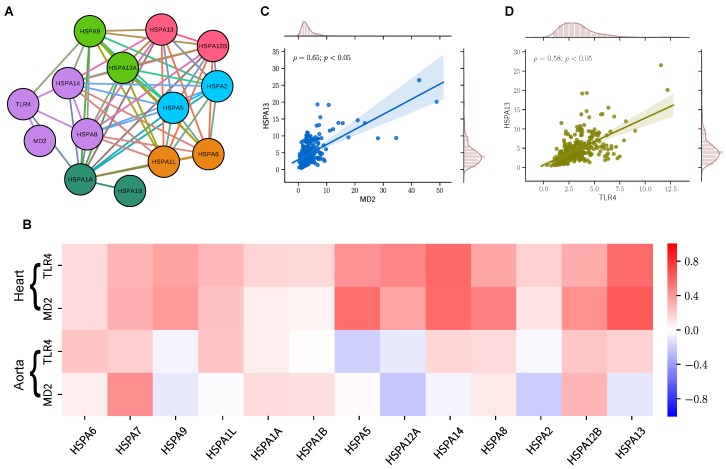
Figure 2.
Evidence of protein-protein interaction in cardiovascular tissues. (A) Network interactivity of the genes of HSP70-family, TLR4 and MD2. Nodes are colored according to the community determined by the Louvain modularity algorithm. (B) Pearson correlation matrix of HSP70-family with TLR4 and MD2 transcriptome expression levels of heart (left ventricle) and aortic human tissues plotted in a red (positive correlation), white (no correlation), and blue (negative correlation). (C,D) Scatter plots of the relationship between expression values in heart (left ventricle) of HSPA13 with MD2, and TLR4 respectively, as well as Pearson correlation coefficient.

