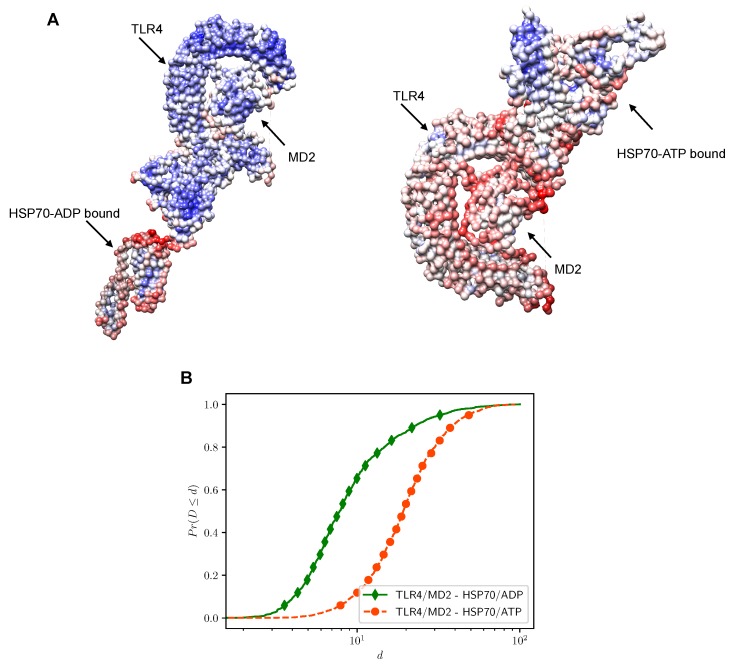
Figure 4.
Normal mode analysis (NMA) of the TLR4/MD2 complex bound to HSP70 in the ADP (2KHO) or ATP (4B9Q) state. Structures were submitted to NMA in the web server iMODS and colored according to their estimated B-factor for deformability (A) using the software UCSF Chimera (version 1.12). The color scale ranges from blue (less flexible region) to red (more flexible region) in a logarithmic scale. The cumulative distribution function (B) shows the pattern of dispersion of deformability (d) throughout the docked conformations.

